
My wife asked me the other day about some mass shooting statistics, in particular some claims of an average of one a day in the US. Without knowing the source, I told her outright it is probably because that person widened the net to events beyond what most people stereotypically consider a mass shooting.
Now, I have no personal opinion on how it should be defined, and being a researcher in criminal justice I appreciate people digging into the details. I was prompted to write this post by an interactive application showing how the numbers change by Kevin Schaul of the Washington Post (referred via Flowing Data). I was pretty frustrated by Kevin’s example interactive application though – there are much simpler ways than making me change the definition and seeing what individual events pop up. Here is an example screen shot of inputting a definition and then how Kevin’s data pop out.
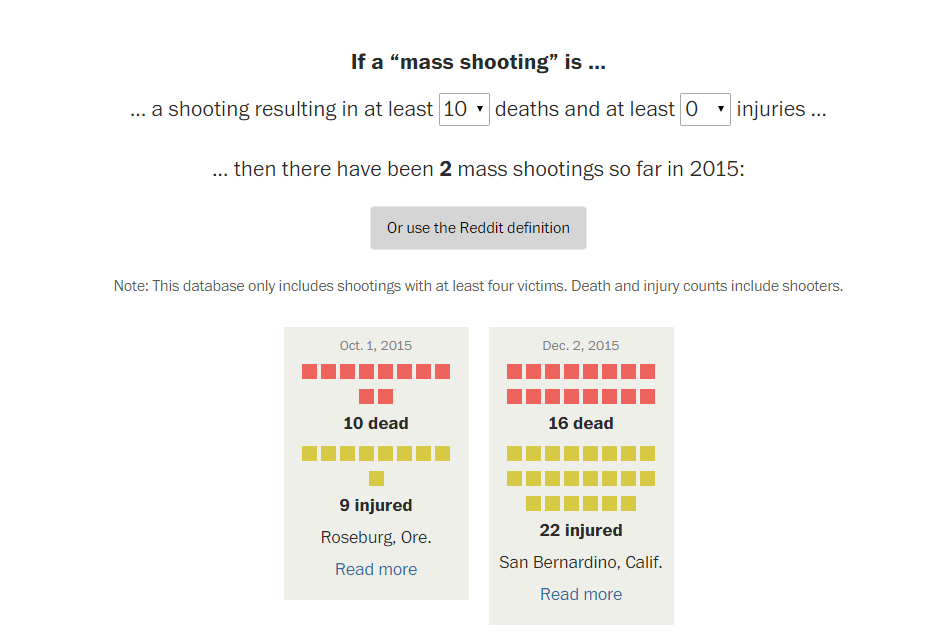
So, downloading the same Reddit data for 2015 so far (as of 12/7/15) I created what I consider to be simple summaries. Caveat – these crowdsourced datasets are likely to have substantial missing data, especially towards the events with fewer injured. First I made a frequency histogram of the total number of dead per incident.
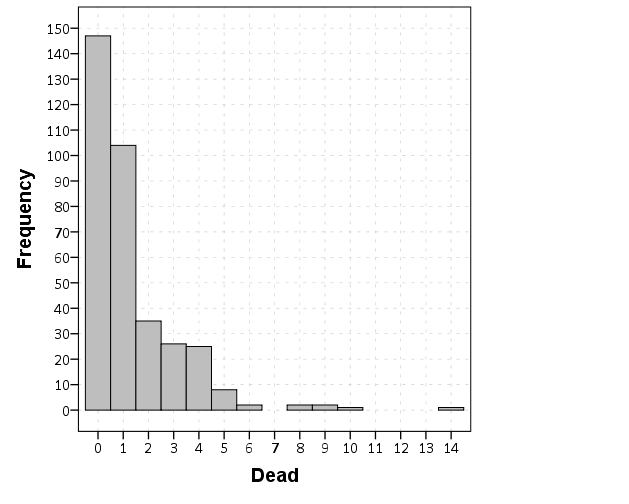
So you can see that if you only want to include dead in your personal definition, the one per day statistic is a dramatic over-representation. If you want to draw the line at 5 or more you will have around 9 more events than you would if you made the line at 6 or more. If you make the line at 10 or more there are only two incidents, but there are another 4 if you include incidents with 8 or 9 dead.
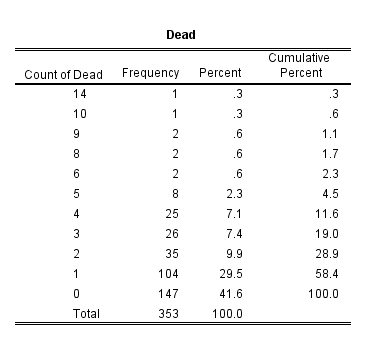
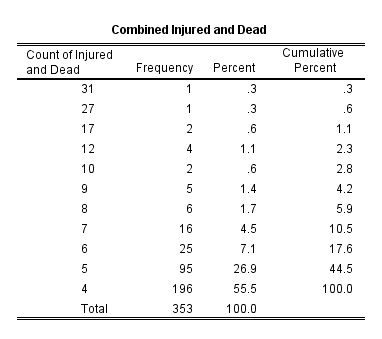
Another simple overview is a table. Here are tables of dead, injured, and the combined counts per each incident, sorted in descending value of the count. So the way to read this is that there there 147 seperate incidents in the reddit database that had 0 deaths, and 104 that had only one death, etc. The tables also have percents and cumulative percentage, so you can see how where you define the cut-point changes how much of the data you chop-off. Cumulative counts would be just as useful.
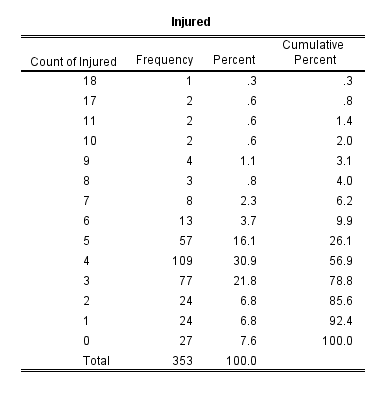
I have no personal problem using injured as well in a mass shooting definition. Basically the difference between being shot and being killed is seemingly due to random happenstance, so a shooting with 10 injured and no one killed can easily be argued to be a mass shooting in my opinion. Kevin’s interactive makes you choose an and condition though between injured and killed, whereas one could place the cut point at an or condition or simply the combined total. Here is a cross tabulation of the frequencies of injured by dead.
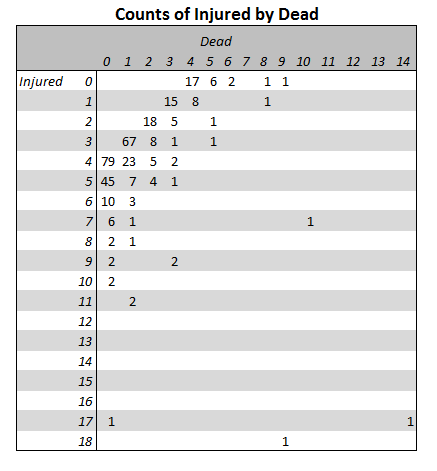
You can clearly see the reddit definition is the combined total of injured or dead is 4 via the line on the upper left of the table. Kevin’s and condition forces you to make a cut-point along each axis, basically choosing a rectangle in the lower right of the above crosstab table. If you want a combined total though, it will be along a diagonal somewhere in the table.
I appreciate these interactive visualizations allow a viewer to dig deeper into specific events in the data, but that does not mean some simple summaries could not also accompany the piece.


1 Comment