Preprint: Analysis of LED street light conversions on firearm crimes in Dallas, Texas

I have a new pre-print out, Analysis of LED street light conversions on firearm crimes in Dallas, Texas. This work was conducted in collaboration with the Child Poverty Action Lab, in reference to the Dallas Taskforce report. Instead of installing the new lights though at hotspots that CPAL suggested, Dallas stepped up conversion of street lamps to LED. Here is the temporal number of conversions over time:

And here is an aggregated quadrat map at quarter square mile grid cells (of the total number of LED conversions):

I use a diff-in-diff design (compare firearm crimes in daytime vs nighttime) to test whether the cumulative LED conversions led to reduced firearm crimes at nighttime. Overall I don’t find any compelling evidence that firearm crimes were reduced post LED installs (for a single effect or looking at spatial heterogeneity). This graph shows in the aggregate the DiD parallel trends assumption holds citywide (on the log scale), but the identification strategy really relies on the DiD assumption within each grid cell (any good advice for graphically showing that with noisy low count data for many units I am all ears!).

For now just wanted to share the pre-print. To publish in peer-review I would need to do a bunch more work to get the lit review where most CJ reviewers would want it. Also want to work on spatial covariance adjustments (similar to here, but for GLM models). Have some R code started for that, but needs much more work/testing before ready for primetime. (Although as I say in the pre-print, these should just make standard errors larger, they won’t impact the point estimates.)

So no guarantees that will be done in anytime in the near future. But no reason to not share the pre-print in the meantime.

CCTV and clearance rates paper published

My paper with Yeondae Jung, The effect of public surveillance cameras on crime clearance rates, has recently been published in the Journal of Experimental Criminology. Here is a link to the journal version to download the PDF if you have access, and here is a link to an open read access version.

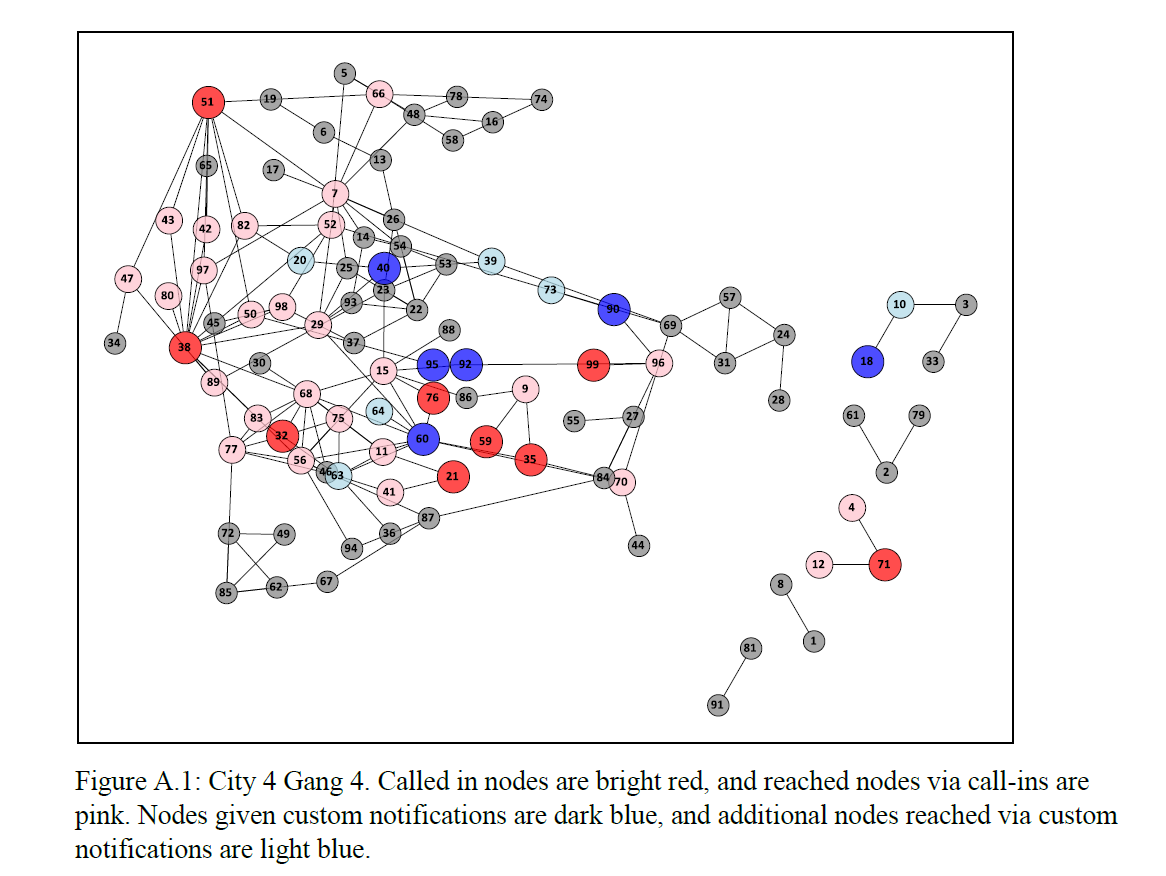
The paper examines the increase in case clearances (almost always arrests in this sample) for incidents that occurred nearby 329 public CCTV cameras installed and monitored by the Dallas PD from 2014-2017. Quite a bit of the criminological research on CCTV cameras has examined crime reductions after CCTV installations, which the outcome of that is a consistent small decrease in crimes. Cameras are often argued to help solve cases though, e.g. catch the guy in the act. So we examined that in the Dallas data.

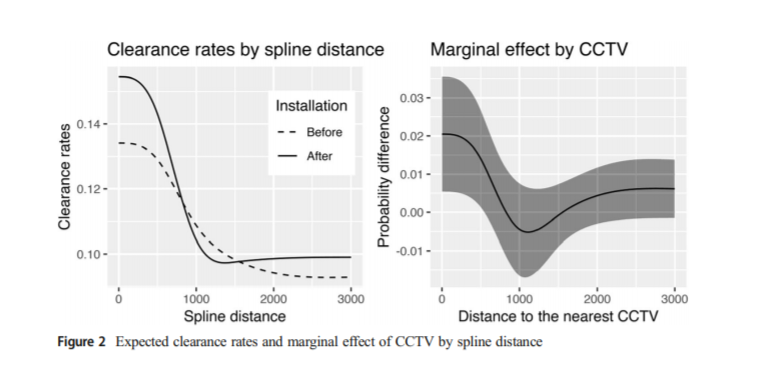
We did find evidence that CCTV increases case clearances on average, here is the graph showing the estimated clearances before the cameras were installed (based on the distance between the crime location and the camera), and the line after. You can see the bump up for the post period, around 2% in this graph and tapering off to an estimate of no differences before 1000 feet.

When we break this down by different crimes though, we find that the increase in clearances is mostly limited to theft cases. Also we estimate counterfactual how many extra clearances the cameras were likely to cause. So based on our model, we can say something like, a case would have an estimated probability of clearance without a camera of 10%, but with a camera of 12%. We can then do that counterfactual for many of the events around cameras, e.g.:

Probability No Camera   Probability Camera   Difference
    0.10                      0.12             + 0.02
    0.05                      0.06             + 0.01
    0.04                      0.10             + 0.06

And in this example for the three events, we calculate the cameras increased the total expected number of clearances to be 0.02 + 0.01 + 0.06 = 0.09. This marginal benefit changes for crimes mostly depends on the distance to the camera, but can also change based on when the crime was reported and some other covariates.

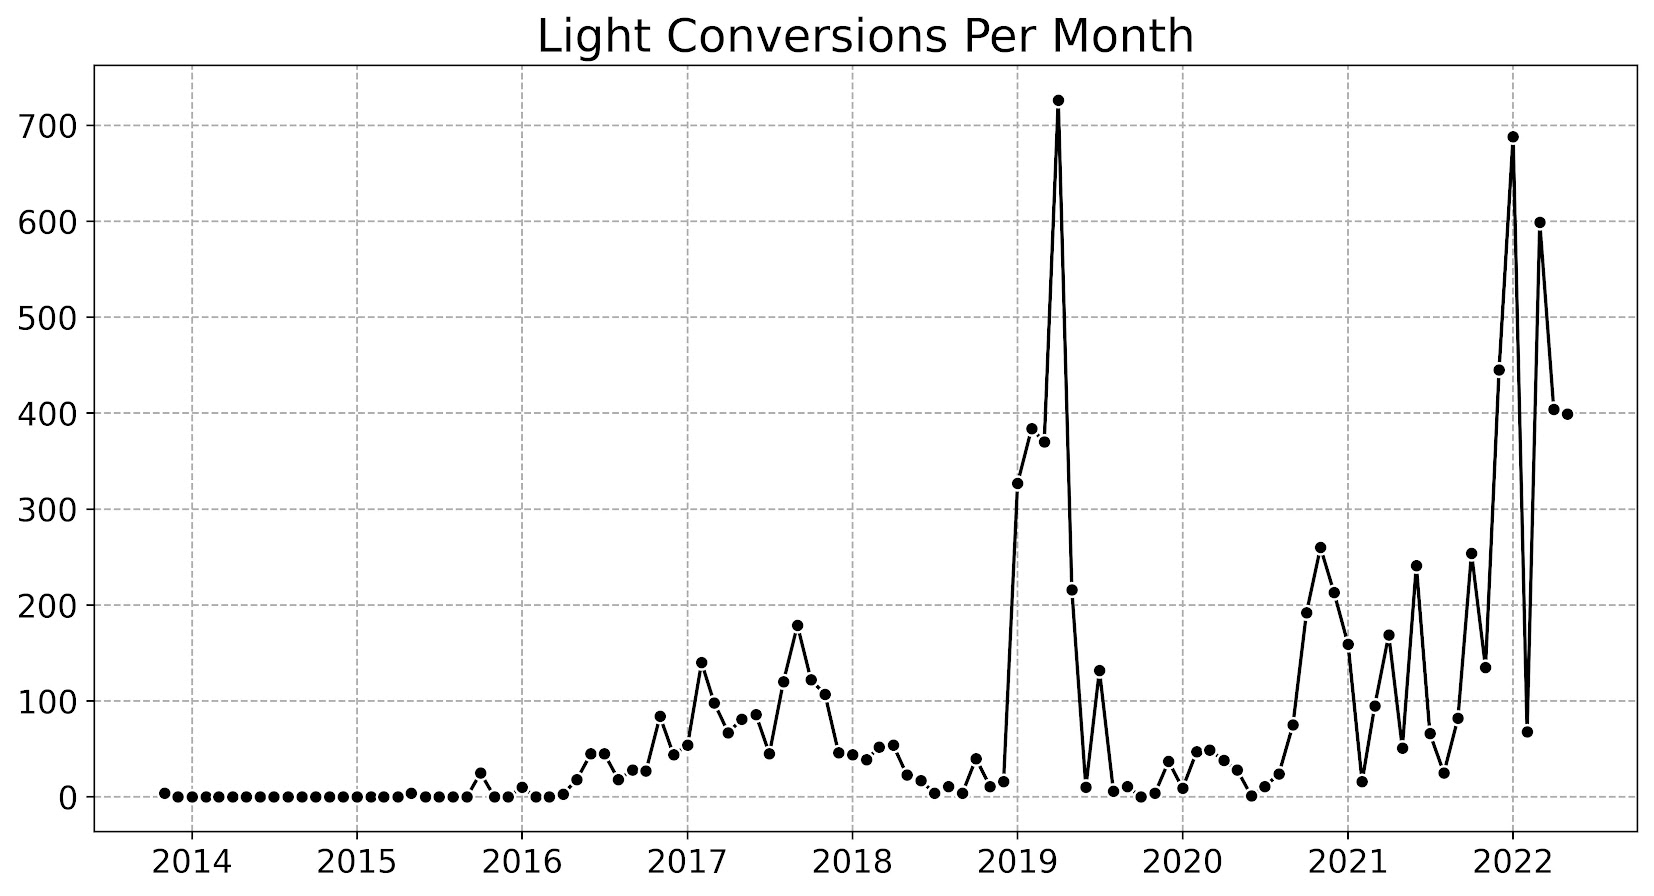
We do this exercise for all thefts nearby cameras post installation (over 15,000 in the Dallas data), and then get this estimate of the cumulative number of extra theft clearances we attribute to CCTV:

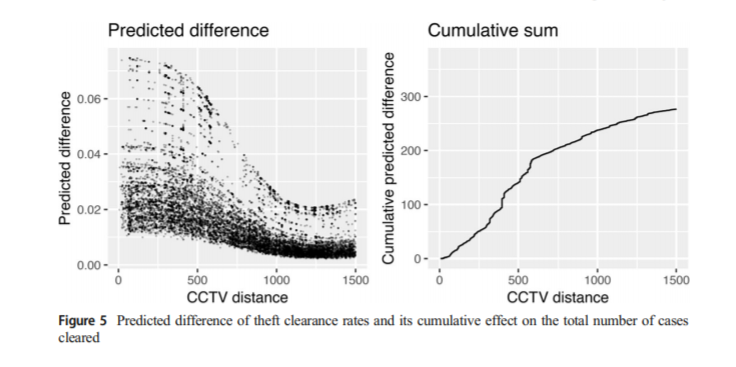
So even with 329 cameras and over a year post data, we only estimate cameras resulted in fewer than 300 additional theft clearances. So there is unlikely any reasonable cost-benefit analysis that would suggest cameras are worthwhile for their benefit in clearing additional cases in Dallas.

For those without access to journals, we have the pre-print posted here. The analysis was not edited any from pre-print to published, just some front end and discussion sections were lightly edited over the drafts. Not sure why, but this pre-print is likely my most downloaded paper (over 4k downloads at this point) – even in the good journals when I publish a paper I typically do not get 1000 downloads.

To go on, complaint number 5631 about peer review – this took quite a while to publish because it was rejected on R&R from Justice Quarterly, and with me and Yeondae both having outside of academia jobs it took us a while to do revisions and resubmit. I am not sure the overall prevalence of rejects on R&R’s, I have quite a few of them though in my career (4 that I can remember). The dreaded send to new reviewers is pretty much guaranteed to result in a reject (pretty much asking to roll a Yahtzee to get it past so many people).

We then submitted to a lower journal, The American Journal of Criminal Justice, where we had reviewers who are not familiar with what counterfactuals are. (An irony of trying to go to a lower journal for an easier time, they tend to have much worse reviewers, so can sometimes be not easier at all.) I picked it up again a few months ago, and re-reading it thought it was too good to drop, and resubmitted to the Journal of Experimental Criminology, where the reviews were reasonable and quick, and Wesley Jennings made fast decisions as well.

Mapping attitudes paper published

My paper (joint work with Jasmine Silver, Rob Worden, and Sarah McLean), Mapping attitudes towards the police at micro places, has been published in the most recent issue of the Journal of Quantitative Criminology. Here is the abstract:

Objectives: We examine satisfaction with the police at micro places using data from citizen surveys conducted in 2001, 2009 and 2014 in one city. We illustrate the utility of this approach by comparing micro- and meso-level aggregations of policing attitudes, as well as by predicting views about the police from crime data at micro places.

Methods: In each survey, respondents provided the nearest intersection to their address. Using that geocoded survey data, we use inverse distance weighting to map a smooth surface of satisfaction with police over the entire city and compare the micro-level pattern of policing attitudes to survey data aggregated to the census tract. We also use spatial and multi-level regression models to estimate the effect of local violent crimes on attitudes towards police, controlling for other individual and neighborhood level characteristics.

Results: We demonstrate that there are no systematic biases for respondents refusing to answer the nearest intersection question. We show that hot spots of dissatisfaction with police do not conform to census tract boundaries, but rather align closely with hot spots of crime. Models predicting satisfaction with police show that local counts of violent crime are a strong predictor of attitudes towards police, even above individual level predictors of race and age.

Conclusions: Asking survey respondents to provide the nearest intersection to where they live is a simple approach to mapping attitudes towards police at micro places. This approach provides advantages beyond those of using traditional neighborhood boundaries. Specifically, it provides more precise locations police may target interventions, as well as illuminates an important predictor (i.e., nearby violent crimes) of policing attitudes.

And this was one of my favorites to make maps. We show how to take surveys and create analogs of hot spot maps of negative sentiment towards police. We do this via asking individuals to list their closest intersection (to still give some anonymity), and then create inverse distance weighted maps of negative attitudes towards police.

We also find in this work that nearby crimes are the biggest factor in predicting negative sentiment towards police. This hints that past results aggregating attitudes to neighborhoods is inappropriate, and that police reducing crime is likely to have the best margin in terms of making people more happy with the police in general.

As always, feel free to reach out for a copy of the paper if you cannot access JQC. (Or you could go a view the pre-print.)

Paper published: Evaluating Community Prosecution Code Enforcement in Dallas, Texas

Some work John Worrall and I collaborated on was just published in Justice Quarterly, Evaluating Community Prosecution Code Enforcement in Dallas, Texas. I have two links to share:

If you need access to the article always feel free to email.

Below is the abstract:

We evaluated a community prosecution program in Dallas, Texas. City attorneys, who in Dallas are the chief prosecutors for specified misdemeanors, were paired with code enforcement officers to improve property conditions in a number of proactive focus areas, or PFAs, throughout the city. We conducted a panel data analysis, focusing on the effects of PFA activity on crime in 19 PFAs over a six-year period (monthly observations from 2010 to 2015). Control areas with similar levels of pre-intervention crime were also included. Statistical analyses controlled for pre-existing crime trends, seasonality effects, and other law enforcement activities. With and without dosage data, the total crime rate decreased in PFA areas relative to control areas. City attorney/code enforcement teams, by seeking the voluntary or court-ordered abatement of code violations and criminal activity at residential and commercial properties, apparently improved public safety in targeted areas.

This was a neat program, as PFAs are near equivalents of hot spots that police focus on. So for the evaluation we drew control areas from Dallas PD’s Target Area Action Grid (TAAG) Areas:

New working paper: Mapping attitudes towards the police at micro places

I have a new preprint posted, Mapping attitudes towards the police at micro places. This is work with Jasmine Silver, as well as Rob Worden and Sarah McLean. See the abstract:

We demonstrate the utility of mapping community satisfaction with the police at micro places using data from citizen surveys conducted in 2001, 2009 and 2014 in one city. In each survey, respondents provided the nearest intersection to their address. We use inverse distance weighting to map a smooth surface of satisfaction with police over the entire city, which shows broader neighborhood patterns of satisfaction as well as small area hot spots of dissatisfaction. Our results show that hot spots of dissatisfaction with police do not conform to census tract boundaries, but rather align closely with hot spots of crime and police activity. Models predicting satisfaction with police show that local counts of violent crime are the strongest predictors of attitudes towards police, even above individual level predictors of race and age.

In this article we make what are analogs of hot spot maps of crime, but measure dissatisfaction with the police.


One of the interesting findings is that these hot spots do not align nicely with census tracts (the tracts are generalized, we cannot divulge the location of the city). So the areas identified by each procedure would be much different.


As always, feel free to comment or send me an email if you have feedback on the article.

Monitoring homicide trends paper published

My paper, Monitoring Volatile Homicide Trends Across U.S. Cities (with coauthor Tom Kovandzic) has just been published online in Homicide Studies. Unfortunately, Homicide Studies does not give me a link to share a free PDF like other publishers, but you can either grab the pre-print on SSRN or always just email me for a copy of the paper.

They made me convert all of the charts to grey scale :(. Here is an example of the funnel chart for homicide rates in 2015.

And here are example fan charts I generated for a few different cities.

As always if you have feedback or suggestions let me know! I posted all of the code to replicate the analysis at this link. The prediction intervals can definately be improved both in coverage and in making their length smaller, so I hope to see other researchers tackling this as well.

New working paper: The effect of housing demolitions on crime in Buffalo, New York

I have a new working paper up, The effect of housing demolitions on crime in Buffalo, New York. This is in conjunction with my colleagues Dae-Young Kim and Scott Phillips, who are at SUNY Buffalo. Below is the abstract.

Objectives: From 2010 through 2015, the city of Buffalo demolished over 2,000 residences. This study examines whether those demolitions resulted in crime reductions.

Methods: Analysis was conducted at micro places matching demolished parcels to comparable control parcels with similar levels of crime. In addition, spatial panel regression models were estimated at the census tract and quarterly level, taking into account demographic characteristics of neighborhoods.

Results: We find that at the micro place level, demolitions cause a steep drop in reported crime at the exact parcel, and result in additional crime decreases at buffers of up to 1,000 feet away. At the census tract level, results indicated that demolitions reduced Part 1 crimes, but the effect was not statistically significant across different models.

Conclusions: While concerns over crime and disorder are common for vacant houses, the evidence that housing demolitions are an effective crime reduction solution is only partially supported by the analyses here. Future research should compare demolitions in reference to other neighborhood revitalization processes.

As always, if you have feedback/comments let me know.

And here are a few maps from the paper!

Paper: The Effect of 311 Calls for Service on Crime in D.C. at Microplaces published

My paper, The Effect of 311 Calls for Service on Crime in D.C. at Microplaces, was published online first at Crime & Delinquency. Here is the link to the published paper. If you do not have access to a library where you can get the paper always feel free to email and I will send an off-print. But I also have the pre-print posted on SSRN. Often the only difference between my pre-prints and the finished version is the published paper is shorter!

As a note, I’ve also posted all of the data and code to replicate my findings. The note is unfortunately buried at the end of the paper, instead of the beginning.

This was the first paper published from my dissertation. I have pre-prints out for two others, What we can learn from small units and Local and Spatial Effect of Bars. Hopefully you will see those two in print the near future as well!

New working paper: Choosing Representatives to Deliver the Message in a Group Violence Intervention

I have a new preprint up on SSRN, Choosing Representatives to Deliver the Message in a Group Violence Intervention. This is what I will be presenting at ACJS next Friday the 24th. Here is the abstract:

Objectives: The group based violence intervention model is predicated on the assumption that individuals who are delivered the deterrence message spread the message to the remaining group members. We focus on the problem of who should be given the initial message to maximize the reach of the message within the group.

Methods: We use social network analysis to create an algorithm to prioritize individuals to deliver the message. Using a sample of twelve gangs in four different cities, we identify the number of members in the dominant set. The edges in the gang networks are defined by being arrested or stopped together in the prior three years. In eight of the gangs we calculate the reach of observed call-ins, and compare these with the sets defined by our algorithm. In four of the gangs we calculate the reach for a strategy that only calls-in members under supervision.

Results: The message only needs to be delivered to around 1/3 of the members to reach 100% of the group. Using simulations we show our algorithm identifies the minimal dominant set in the majority of networks. The observed call-ins were often inefficient, and those under supervision could be prioritized more effectively.

Conclusions: Group based strategies should monitor their potential reach based on who has been given the message. While only calling-in those under supervision can reach a large proportion of the gang, delivering the message to those not under supervision will likely be needed to reach 100% of the group.

And here is an image of the observed reach for one of the gang networks using both call-ins and custom notifications.

The paper has the gang networks available at this link, and uses Python to do the network analysis and SPSS to draw the graphs.

If you are interested in applying this to your work let me know! Not only do I think this is a good idea for focused deterrence initiatives for criminal justice agencies, but I think the idea can be more widely applied to other fields in social sciences, such as public health (needle clean/dirty exchange programs) or organizational studies (finding good leaders in an organization to spread a message).

Paper on Roadblocks in Buffalo published

My paper with Scott Phillips, A quasi-experimental evaluation using roadblocks and automatic license plate readers to reduce crime in Buffalo, NY, has just been published online first in the Security Journal. Springer gifts me a special link in which you can read the paper. Previously when I have been given links like that from the publisher they have a time limit, but the email for this one said nothing. But even if that goes bad you can always read my pre-print of the article I posted on SSRN.


Title: A quasi-experimental evaluation using roadblocks and automatic license plate readers to reduce crime in Buffalo, NY

Abstract:

This article evaluates the effective of a hot spots policing strategy: using automated license plate readers at roadblocks in Buffalo, NY. Different roadblock locations were chosen by the Buffalo Police Department every day over a two-month period. We use propensity score matching to identify a set of control locations based on prior counts of crime and demographic factors. We find modest reductions in Part 1 violent crimes (10 over all roadblock locations and over the two months) using t tests of mean differences. We find a 20% reduction in traffic accidents using fixed effects negative binomial regression models. Both results are sensitive to the model used though, and the fixed effects models predict increases in crimes due to the intervention. We suggest that the limited intervention at one time may be less effective than focusing on a single location multiple times over an extended period.

And here is Figure 2 from the paper, showing the units of analysis (street midpoints and intersections) and how the treatment locations were assigned.