
My paper, Monitoring Volatile Homicide Trends Across U.S. Cities (with coauthor Tom Kovandzic) has just been published online in Homicide Studies. Unfortunately, Homicide Studies does not give me a link to share a free PDF like other publishers, but you can either grab the pre-print on SSRN or always just email me for a copy of the paper.
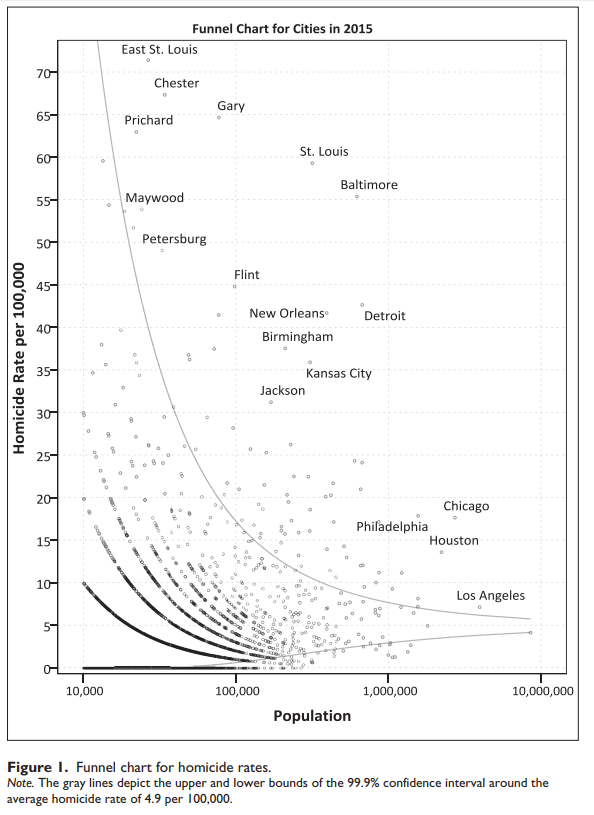
They made me convert all of the charts to grey scale :(. Here is an example of the funnel chart for homicide rates in 2015.
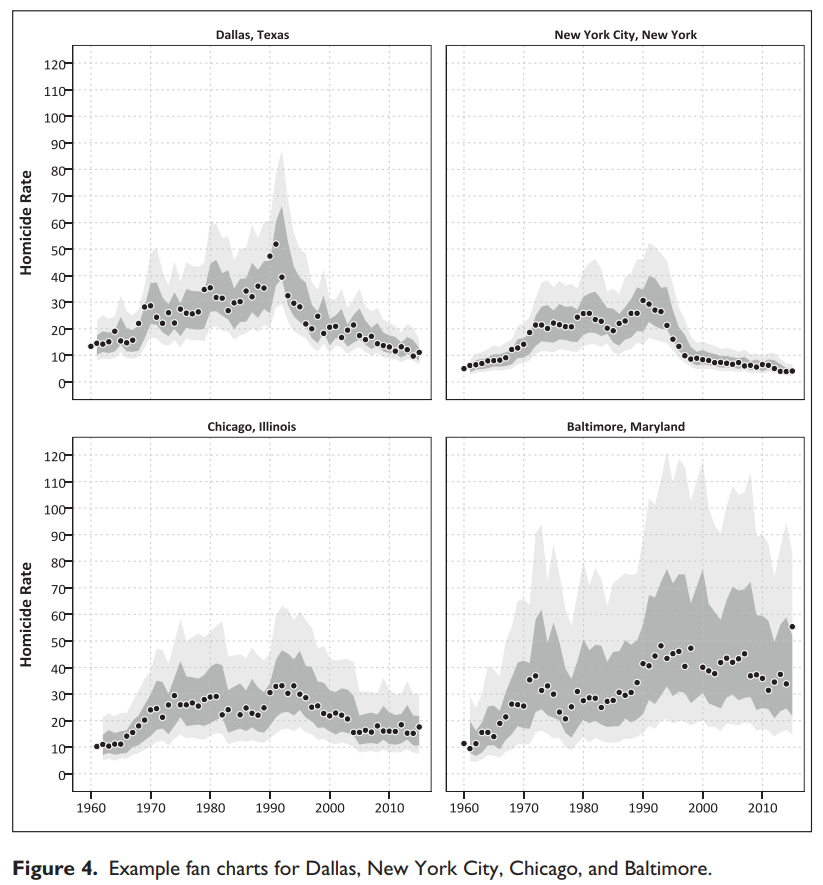
And here are example fan charts I generated for a few different cities.
As always if you have feedback or suggestions let me know! I posted all of the code to replicate the analysis at this link. The prediction intervals can definately be improved both in coverage and in making their length smaller, so I hope to see other researchers tackling this as well.

