Over 10 years of blogging

I just realized the other day that I have been blogging for over 10 years (I am old!) First hello world post post was back in December 2011.

I would recommend folks in academia/coding to at a minimum do a personal webpage. I use wordpress for my blog (did a free wordpress for quite a long time). WordPress is 0 code to make a personal page to host your CV.

I treat the blog as mostly my personal nerd journal, and blog about things I am working on or rants on occasion. I do not make revenue off of the blog directly, but in terms of getting me exposure it has given quite a few consulting leads over the years. As well as just given my academic work a much wider exposure.

So I always have a few things I want to blog about in the hopper. But always feel free to ask me anything (similar to how Andrew Gelman answers emails), and if I get a chance I will throw up a blog post in response.

My Year Blogging in Review – 2018

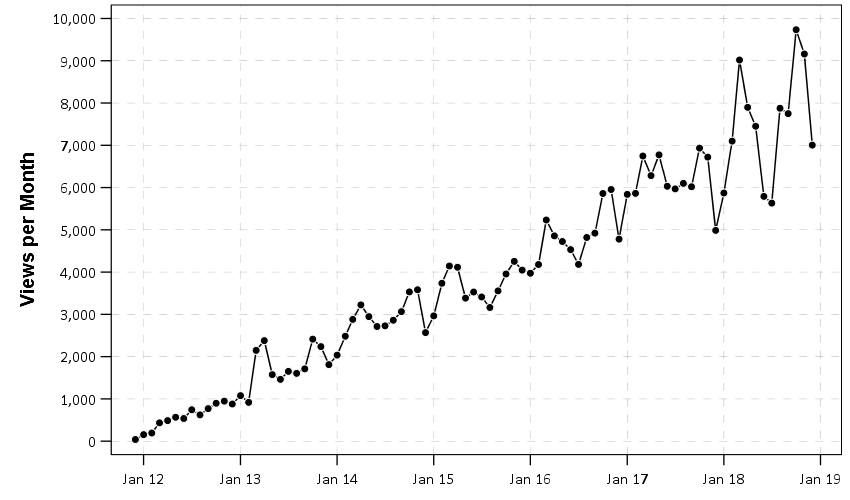
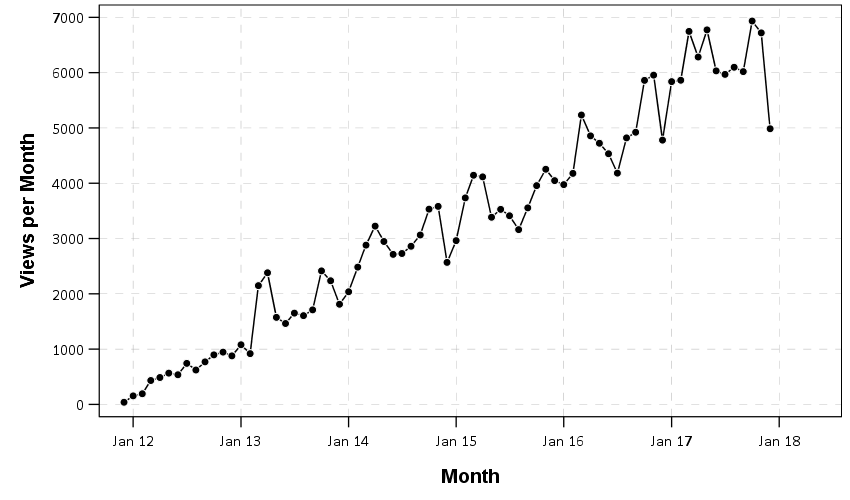
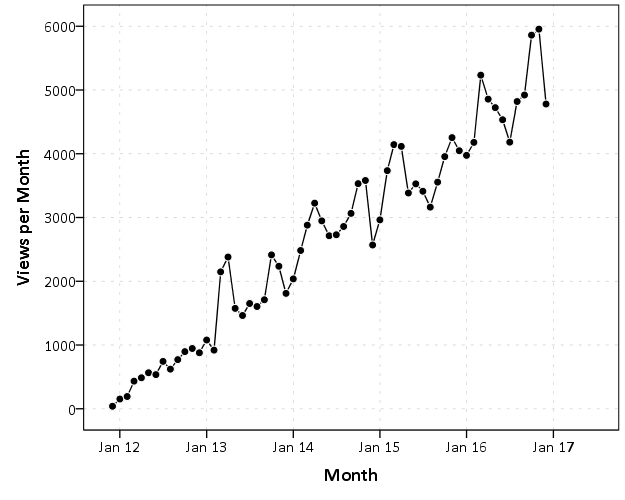
The blog continues to grow in site views. I had a little north of 90,000 site views over the entire year. (If you find that impressive don’t be, a very large proportion are likely bots.)

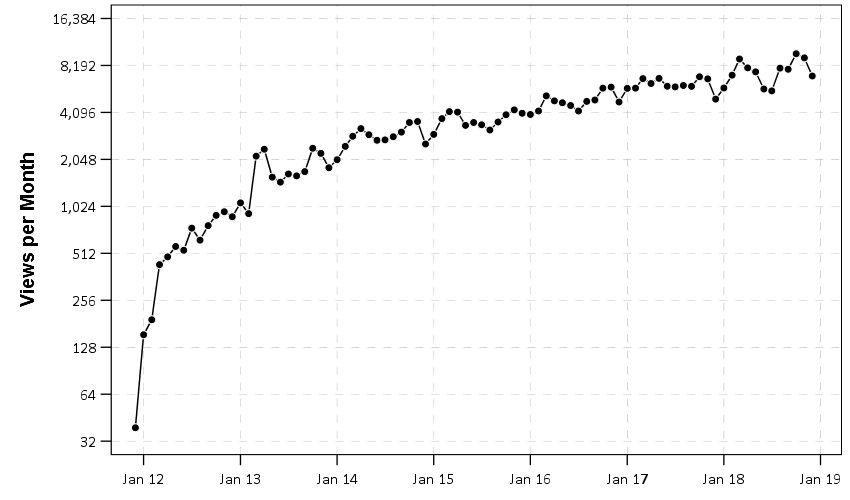
The trend on the original count scale looks linear, but on the log scale the variance is much nicer. So I’m not sure what the best forecast would be.

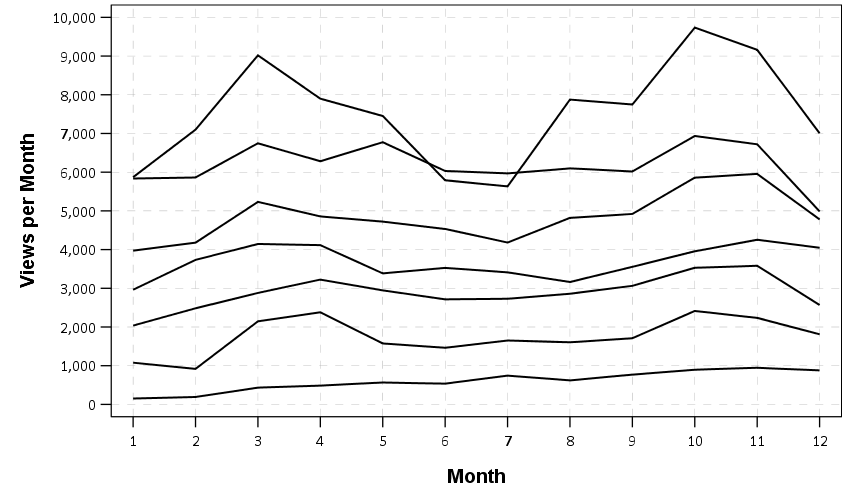
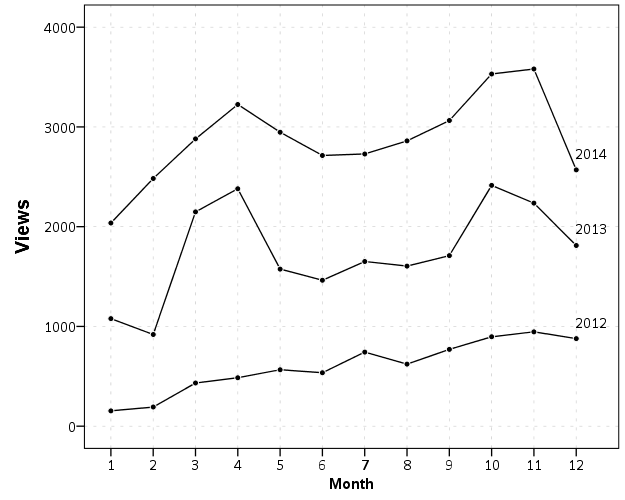
I thought the demise had already started earlier in the year, as I actually saw the first year-over-year decreases in June and July. But the views recovered in the following months.

So based on that the slow down in growth I think is a better bet than the linear projection.

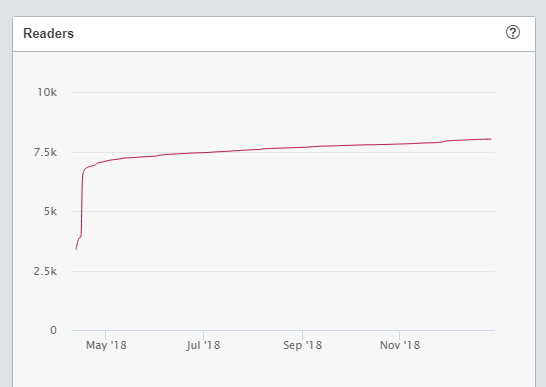
For those interested in extending their reach, you should not only consider social media and creating a website/blog, but also writing up your work for a more general newspaper. I wrote an article for The Conversation about some of my work on officer involved shootings in Dallas, and that accumulated nearly 7,000 views within a week of it being published.

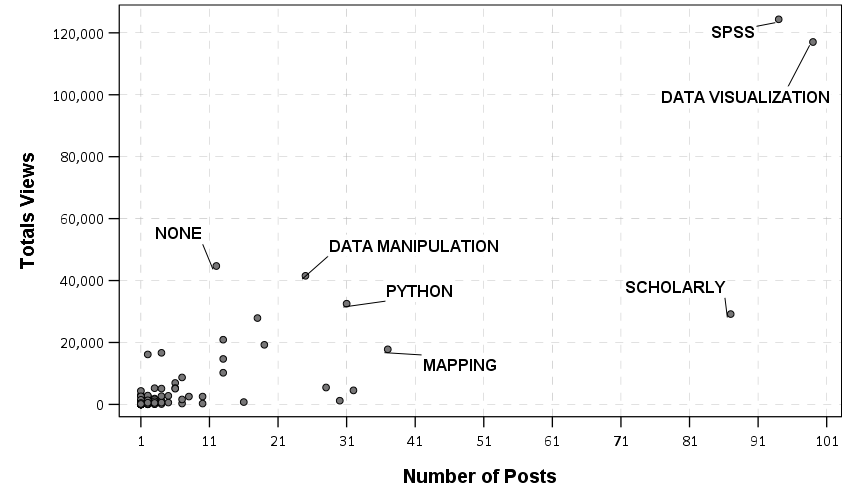
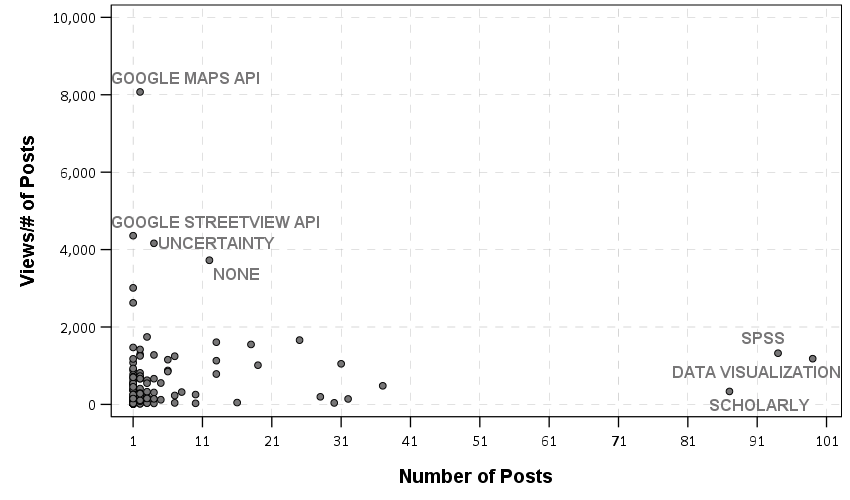
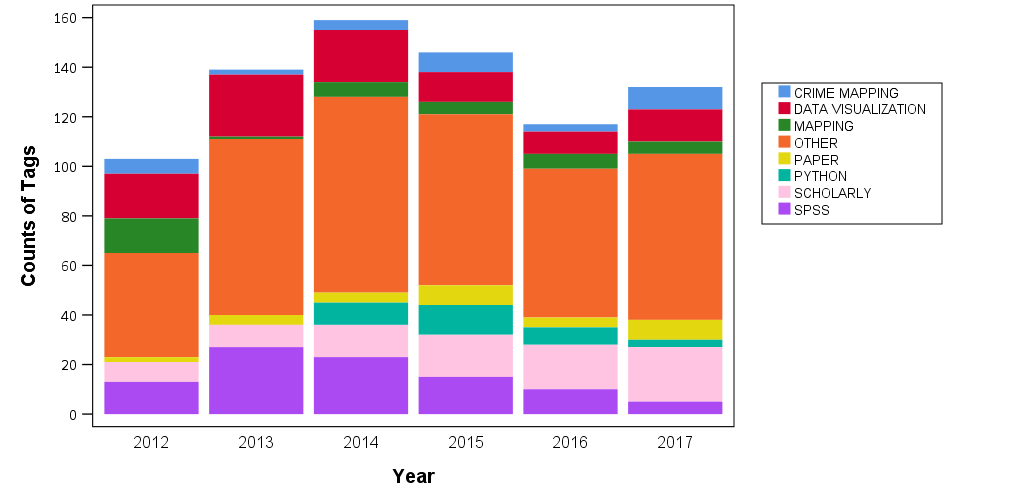
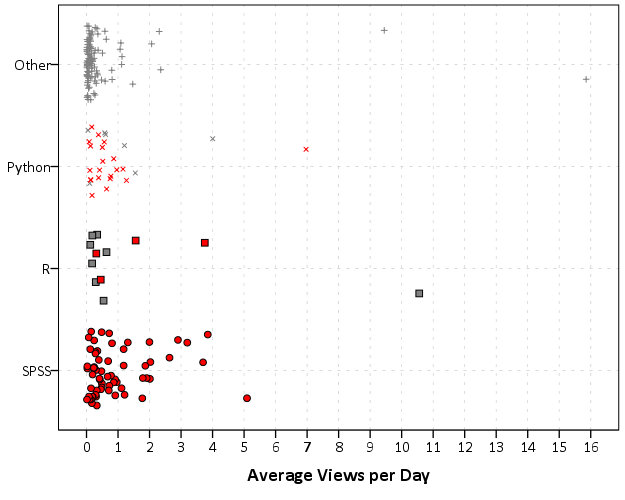
Engagement in a greater audience is very bursty. Looking at my statistics for particular articles, it doesn’t make much sense to report average views per day. I tend to get a ton of views on the first few days, and then basically nothing after that. So if I do the top posts by average views per day it is dominated by my more recent posts.

This is partly due to shares on Twitter, which drive short term views, but do not impact longer term views as far as I can tell. That is a popular post on Twitter does not appear to predict consistent views being referred via Google searches. In the past year I get a ratio of about 50~1 referrals from Google vs Twitter, and I did not have any posts that had a consistent number of views (most settle in at under 3 views per day after the initial wave). So basically all of my most viewed posts are the same as prior years.

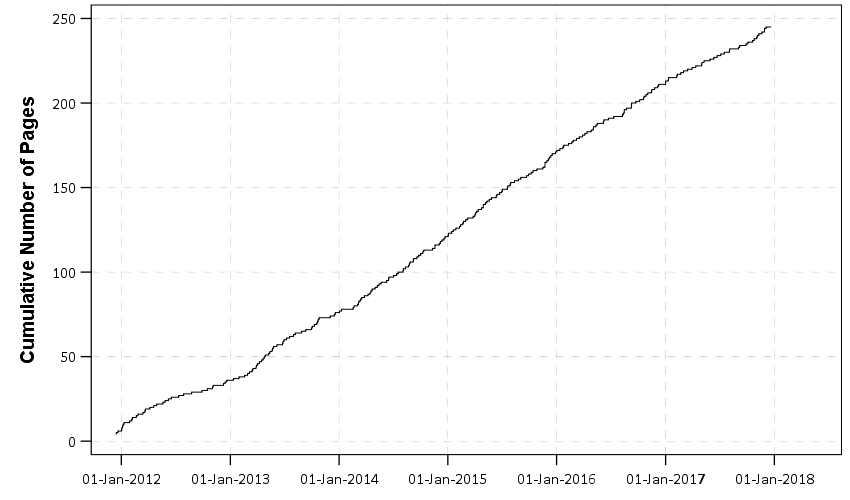
Since I joined Twitter this year, I actually have made fewer blog posts. Not including this post, I’ve made 29 posts in 2018.

2011  5
2012 30
2013 40
2014 45
2015 50
2016 40
2017 35
2018 29

Some examples of substitution are tweets when a paper is published. I typically do a short write up when I post a working paper — there is not much point of doing another one when it is published online. (To date I have not had a working paper greatly change from the published version in content.) I generally just like sharing nice graphs I am working on. Here is an example of citations over time I just quickly published to Twitter, which was simpler than doing a whole blog post.

https://twitter.com/CrimAndyW/status/998566125381324801

Since it is difficult to determine how much engagement I will get for any particular post, it is important to just keep plugging away. Twitter can help a particular post take off (see these examples I wrote about for the Cross Validated Blog), but any one tweet or blog post is more likely to be a dud than anything.

My Year Blogging in Review – 2017

So the blog has continued to show linear growth in terms of views over time, I take a good hit though in December.

I only ended up writing 35 new posts in 2017 (that includes things that are not blog posts, like pages I created for new classes). For comparison in 2015 I wrote 50, and 2016 I wrote 40. I’ve managed to be pretty consistent though over time, here is the cumulative total over time.

That is more or less what I aim for, to just have some content every few weeks.

There is not much to say in terms of popular posts on the site for the year. My most popular posts are ones I’ve written in previous years. I did not have any post this year gain a large number of viewers when it was first written. It is just a slow accumulation of around 200 views per day, mostly people being referred via Google searches.

I wanted to analyze the topics I’ve written about over time, so I grabbed all of the tags I’ve placed on posts. I collapsed both categories and tags, as I don’t really make much of a distinction when I pick them. Here is a graph of the number of posts that have that tag and the page views (this will double count page views, for example a post could have both SPSS and Data Visualization). None refers to pages that are not blog posts, like my home page and pages I created for class syllabi.

If we look at the ratio though, you can see my scholarly posts are mostly ignored, only in total do they accumulate much viewing.

My posts on showing how to use various google maps services with python must be reasonably high in Google searches, as I get a slow trickle of hits for them every day. The high uncertainty is driven by my ratios need to be plotted on log scales post.

I tried to analyze whether the content of my posts substantively has changed over time. I suspected since I took my job at Dallas my posts swayed more towards paper/scholarly (the tag I use for academic related things) and more away from technical computing stuff. I have too few of posts though (and too many tags) to easily make sense of it. Taking only tags that are included on 30 or more posts, here are the counts of those tags over time.

About the only clear trend is that scholarly has risen with SPSS dropping, the other frequent categories though look to me to be fairly consistent. I could spend more time grouping the tags into thematic content, but I have too many other things I need to do (including writing other blog posts)!

Happy New Year!

Blogging in Review – 2016

The site has continued to grow in 2016. Looking back over the prior years it has looked pretty linear the whole time.

I take a hit in December, but I almost managed on average 200 site views per day in November. I topped the 100,000 cumulative site views for the entire blogs existence in November of this year.

Despite moving from Albany to Texas, I still managed to publish 40 new pages this year, which I am pretty happy with. I don’t set myself with any hard expectations, but I like to publish something at least once every two to four weeks.

While some of my initial traffic is bursty, e.g. gets shared on a popular site and you get a couple hundred views in a day, most of my traffic is a slow trickle of referrals from google. Here is a plot of my pages by average views per day, broken down by some of my main categories. Posts colored in red have an SPSS tag, and so the Python and R columns can also be posts on SPSS. (So most of my python posts are calling python from SPSS.)

So even my most popular posts do not average more than a few views per day, and most do not get any appreciable traffic at all. Here are the labels in that dot plot to show what posts they are.

Don’t ask me why some end up being more popular than others (who knew Venn diagrams in R?). I wrote a few more blog posts on using various google maps APIs with python in response to the google places post being popular. The google street view post is doing pretty well, the others not so much though.

My motivation for posts though are more in line with an academic journal/notebook/diary – I post on some project I am working on essentially, I don’t go and research specific topics just for the blog. I am happy with the extra exposure though – and I’m sure there is more value added to a tutorial blog post than there is for a stuffy academic paper that is read by two dozen individuals (even if that is what counts towards my tenure)!

2014 Blog stats, and why Blogging >> Articles

The readership of the blog has continued to grow. Here are the total site views per month since the beginning in December 2011.

At this point we can start to see some seasonal patterns. I take a big hit in December and January, and increases when school is in session. I get quite a bit of my traffic from SPSS searches, so I presume much of the traffic are students using SPSS.

I do not worry too much about posting regularly, but I like to take some time if I have not published anything in around 2 weeks. I just enjoy taking a break from a specific work projects, and often I blog about something I have dealt with multiple times (or answered peoples questions multiple times) so I like making a blog post for my own and others reference.

Now, one of the more popular posts I have written is Odds Ratios NEED To Be Graphed On Log Scales. This I published in October 2013, recieved around 100 referrals from twitter the day I published it, and since has averaged about 5-10 views per day (it has accumulated a total of near 3,000 total). It is one of the first sites returned for odds ratio graph from a google search.

Certainly not a number of views to write home to my mother about, but I believe it is better outreach of my opinion than a journal article (not that I would be able to publish such a limited point in a journal article anyway). Take for instance Rothman et al.’s 2011 article, Should Graphs of Risk or Rate Ratios be Plotted on a Log Scale? in the American Journal of Epidemiology that has a differing opinion of mine. I can not find any readership stats for AJE, but I highly doubt that article has been viewed by 3,000 people, and according to google scholar it only has 2 citations currently. One is the response by the editor to the article, and the other is likely in error as it was published before the Rothman article. Site views are superficial as well, but I would place a wager my blog post has reached more readers than the Rothman article. 3,000 is way higher than views or downloads for my papers on SSRN, and even the most viewed articles since 2011 on the Cartography and GIS website have not accumulated 3,000 downloads at this point. (My Viz JTC paper has just over 100 downloads so far after being up for close to a year at this point.) AJE articles very likely have a larger readership than CaGIS – but I have no idea how much larger. I would guess the American Statistician has a more comparable (likely larger?) membership via the ASA, and articles from the first issue of 2014 have accumulated mostly between 200 and 1500 downloads currently (the last issue of 2013 is quite a bit lower). I suspect a download is a bit more of an investment than a page view of my blog (so both are over-estimates of those actually reading the article, but page views are likely a larger over-estimate). But in most cases I get so many more views on the blog compared to that I would an article outreach on the blog is clearly the winner. The audience is different as well, not necessarily better or worse, just different.

I don’t take my work as venerable as Ken Rothman’s (obviously he is a well respected and influential epidemiologist or methodologist more generally for his books), but I disagree with his reasoning for using linear scales in some circumstances in the referenced article. My general response to the Rothman example is that if you want to show absolute risk differences then show them. Plotting the ratios on an arithmentic scale is misleading, and while close for his example is still not as accurate as just plotting the risk differences. In Rothman et al.’s example plotting the odds ratios would result in an overestimate of the absolute risk differences by over 10%! (The absolute risk difference is 90 - 1 = 89, whereas the linear difference between the odds is 10 - .01 = 9.99. The former mapped onto a scale from 0 to 10 would result in a length of 8.9, so an over estimate of (9.99 - 8.9)/8.9 ~ 12%.)

I don’t take blogging as a replacement for academic work, more like an open nerd journal. I’m pretty sure this venue has quite a bit more readership than my journal articles ever will though.