New paper: An Open Source Replication of a Winning Recidivism Prediction Model

Our paper on the NIJ forecasting competition (Gio Circo is the first author), is now out online first in the International Journal of Offender Therapy and Comparative Criminology (Circo & Wheeler, 2022). (Eventually it will be in special issue on replications and open science organized by Chad Posick, Michael Rocque, and Eric Connolly.)

We ended up doing the same type of biasing as did Mohler and Porter (2022) to ensure fairness constraints. Essentially we biased results to say no one was high risk, and this resulted in “fair” predictions. With fairness constraints or penalities you sometimes have to be careful what you wish for. And because not enough students signed up, me and Gio had more winnings distributed to the fairness competition (although we did quite well in round 2 competition even with the biasing).

So while that paper is locked down, we have the NIJ tech paper on CrimRXiv, and our ugly code on github. But you can always email for a copy of the actual published paper as well.

Of course since not an academic anymore, I am not uber focused on potential future work. I would like to learn more about survival type machine learning forecasts and apply it to recidivism data (instead of doing discrete 1,2,3 year predictions). But my experience is the machine learning models need very large datasets, even the 20k rows here are on the fringe where regression are close to equivalent to non-linear and tree based models.

Another potential application is simple models. Cynthia Rudin has quite a bit of recent work on interpretable trees for this (e.g. Liu et al. 2022), and my linked post has examples for simple regression weights. I suspect the simple regression weights will work reasonably well for this data. Likely not well enough to place on the scoreboard of the competition, but well enough in practice they would be totally reasonable to swap out due to the simpler results (Wheeler et al., 2019).

But for this paper, the main takeaway me and Gio want to tell folks is to create a (good) model using open source data is totally within the capabilities of PhD criminal justice researchers and data scientists working for these state agencies.They are quantitaive skills I wish more students within our field would pursue, as it makes it easier for me to hire you as a data scientist!

References

Variance of leaderboard metrics for competitions

In doing a post mortem on our results for the NIJ recidivism challenge, first I calculated the extent to which our predictions would have done better if we did not bias our predictions to meet the fairness challenge. In the end, for Round 1 our team would have been in 3rd or 4th place for the small team rankings if we went with the unbiased predictions. It ended up being it only increased our Brier score by around ~0.001-0.002 though for each. (So I am glad we biased with a chance to win the fairness competition in the end.)

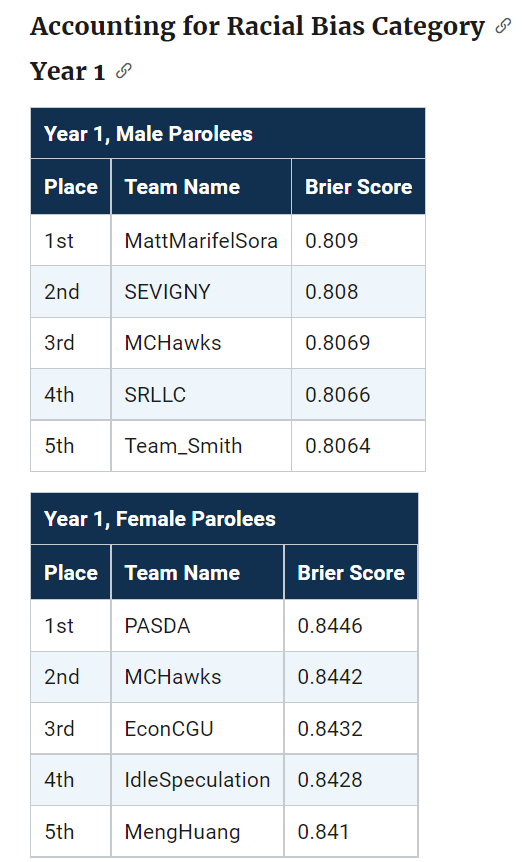
The leaderboards are so tight across the competition, often you need to go to the fourth decimal to determine the rankings. Here are the rankings for Round 1 Brier Scores for the small team:

Ultimately these metrics used to determine the rankings are themselves statistics measured with error. So here I did a simulation to see the extent that these metrics had error.

These are not exactly the models we ended up using, but are very close (only performed slightly worse than the ones we ended up going with), but here I will show an example in python comparing rankings between a logit regression with L1 penalties vs a lightboosted model. So for some upfront on the python libraries I will be using, and I download the data directly:

import numpy as np
import pandas as pd
from scipy.stats import binom
from sklearn.linear_model import LogisticRegression
from lightgbm import LGBMClassifier
from sklearn.metrics import roc_auc_score, brier_score_loss

full_data = pd.read_csv('https://data.ojp.usdoj.gov/api/views/ynf5-u8nk/rows.csv?accessType=DOWNLOAD',index_col='ID')

The next part is just encoding the data. I am doing this for R1, so only using a certain set of information.

# Numeric Impute
num_imp = ['Gang_Affiliated','Supervision_Risk_Score_First',
           'Prior_Arrest_Episodes_DVCharges','Prior_Arrest_Episodes_GunCharges',
           'Prior_Conviction_Episodes_Viol','Prior_Conviction_Episodes_PPViolationCharges',
           'Residence_PUMA']

# Ordinal Encode (just keep puma as is)
ord_enc = {}
ord_enc['Gender'] = {'M':1, 'F':0}
ord_enc['Race'] = {'WHITE':0, 'BLACK':1}
ord_enc['Age_at_Release'] = {'18-22':6,'23-27':5,'28-32':4,
                  '33-37':3,'38-42':2,'43-47':1,
                  '48 or older':0}
ord_enc['Supervision_Level_First'] = {'Standard':0,'High':1,
                         'Specialized':2,'NA':-1}
ord_enc['Education_Level'] = {'Less than HS diploma':0,
                              'High School Diploma':1,
                              'At least some college':2,
                              'NA':-1}
ord_enc['Prison_Offense'] = {'NA':-1,'Drug':0,'Other':1,
                             'Property':2,'Violent/Non-Sex':3,
                             'Violent/Sex':4}
ord_enc['Prison_Years'] = {'Less than 1 year':0,'1-2 years':1,
                           'Greater than 2 to 3 years':2,'More than 3 years':3}

# _more clip 
more_clip = ['Dependents','Prior_Arrest_Episodes_Felony','Prior_Arrest_Episodes_Misd',
             'Prior_Arrest_Episodes_Violent','Prior_Arrest_Episodes_Property',
             'Prior_Arrest_Episodes_Drug',
             'Prior_Arrest_Episodes_PPViolationCharges',
             'Prior_Conviction_Episodes_Felony','Prior_Conviction_Episodes_Misd',
             'Prior_Conviction_Episodes_Prop','Prior_Conviction_Episodes_Drug']

# Function to prep data as I want, label encode
# And missing imputation
def prep_data(data,ext_vars=['Recidivism_Arrest_Year1','Training_Sample']):
    cop_dat = data.copy()
    # Numeric impute
    for n in num_imp:
        cop_dat[n] = data[n].fillna(-1).astype(int)
    # Ordinal Recodes
    for o in ord_enc.keys():
        cop_dat[o] = data[o].fillna('NA').replace(ord_enc[o]).astype(int)
    # _more clip
    for m in more_clip:
        cop_dat[m] = data[m].str.split(' ',n=1,expand=True)[0].astype(int)
    # Only keeping variables of interest
    kv = ext_vars + num_imp + list(ord_enc.keys()) + more_clip
    return cop_dat[kv].astype(int)

pdata = prep_data(full_data)

I did smart ordinal encoding, minus the missing data. So logit models are not super crazy with this data, although dummy variables + imputatation are likely a better approach (I am just being lazy here). But those should not be an issue for the tree based boosted models. Here I estimate models using the original train/test split chosen by NIJ:

y_var = 'Recidivism_Arrest_Year1'
x_vars = list(pdata)
x_vars.remove(y_var)
x_vars.remove('Training_Sample')

cat_vars = list( set(x_vars) - set(more_clip) )

l1 = LogisticRegression(penalty='l1', solver='liblinear')
lb = LGBMClassifier(silent=True)

# Original train/test split
train = pdata[pdata['Training_Sample'] == 1].copy()
test = pdata[pdata['Training_Sample'] == 0].copy()

# Fit models, and then eval on out of sample
l1.fit(train[x_vars],train[y_var])
lb.fit(train[x_vars],train[y_var],feature_name=x_vars,categorical_feature=cat_vars)

l1pp = l1.predict_proba(test[x_vars])[:,1]
lbpp = lb.predict_proba(test[x_vars])[:,1]

And then we can see how our two models do in this scenario according to the AUC or the Brier score statistic.

# ROC for the models
aucl1 = roc_auc_score(test[y_var],l1pp)
auclb = roc_auc_score(test[y_var],lbpp)
print(f'AUC L1 {aucl1}, AUC LightBoosted {auclb}')

# Brier score for models
bsl1 = brier_score_loss(test[y_var],l1pp)
bslb = brier_score_loss(test[y_var],lbpp)
print(f'Brier L1 {bsl1}, Brier LightBoosted {bslb}')

So you can see that the L1 model wins over the light boosted model (despite the wonky encoding with missing data) for both the AUC (+0.002) and the Brier Score (+0.001). (Note this is for the pooled sampled for both males/females.)

But is this just luck of the draw for the particular train/test dataset? That is, when we chose another train/test split, but fit the same models, would the light boosted model win some of the time? Here I do that, using the approximately 70% train/test split, but make it random and then estimate the test set Brier/AUC.

res = [] #list to stuff results into

for i in range(1000):
    print(f'Round {i}')
    rand_train = binom.rvs(1,0.7,size=pdata.shape[0])
    train = pdata[rand_train == 1].copy()
    test = pdata[rand_train == 0].copy()
    l1.fit(train[x_vars],train[y_var])
    lb.fit(train[x_vars],train[y_var],feature_name=x_vars,categorical_feature=cat_vars)
    l1pp = l1.predict_proba(test[x_vars])[:,1]
    lbpp = lb.predict_proba(test[x_vars])[:,1]
    aucl1 = roc_auc_score(test[y_var],l1pp)
    auclb = roc_auc_score(test[y_var],lbpp)
    bsl1 = brier_score_loss(test[y_var],l1pp)
    bslb = brier_score_loss(test[y_var],lbpp)
    loc_tup = (i,aucl1,auclb,bsl1,bslb)
    res.append(loc_tup)

fin_data = pd.DataFrame(res,columns=['Iter','AUCL1','AUCLB','BSL1','BSLB'])

fin_data.describe().T
# L1 wins for Brier score
(fin_data['BSL1'] < fin_data['BSLB']).mean()
# L1 wins for AUC
(fin_data['AUCL1'] > fin_data['AUCLB']).mean()

So you can see that the standard deviation for AUC is around 0.005, and the Brier Score is 0.002, also based on the means/min/max we can see that these two models have quite a bit of overlap in the distribution.

But, the results are correlated – when L1 tends to do worse, lightboosted also does worse. So when we look at the rankings, in this scenario L1 wins the majority of the time (but not always). This suggests to me that it was a good thing NIJ did not use AUC to judge, Brier scores seem much less volatile than AUC in this sample.

We can check out the correlations between the scores. AUC only has a correlation of around 0.8, whereas Brier has a correlation of 0.9. (If correlations were 1 the train/test split wouldn’t matter, the same person would always win in the rankings.)

# Results tend to be fairly correlated
fin_data.corr()
fin_data.cov()

But despite these models having a clear winner in this example, the margins between these two models are larger than the margins in the typical leaderboards. So I did a simulation using the observed leaderboard Brier scores for males for R1 as the means, and used the variance/covariance estimates above to make random draws.

This shows us, given the four observed leaderboard metrics, and my guesstimates for the typical error, how often will the leaders flip. Tighter scores and larger variances mean more flips.

# Simulation to see how often rankings flip
mu = np.array([0.1916, 0.1919, 0.1920, 0.1922])
tv = len(mu)
sd = 0.002 # sd and corr based on my earlier simulation
cor = 0.9
var = sd**2
cov = cor*(sd**2)

# filling the var/covariance matrix
r = np.ones((tv,tv)) * cov
np.fill_diagonal(r, var)

# Generating random multivariate normal
np.random.seed(10)
y = np.random.multivariate_normal(mu, r, size=1000)
y_ranks = y.argsort(axis=1)

# Making a nicer long dataset to see how often ranks swapped
persons = ['IdleSpeculation','SRLLC','Sevigny','TeamSmith']
y_rankdf = pd.DataFrame(y_ranks,columns=persons)
longy = y_rankdf.melt()

# How often are the ranks switched?
pd.crosstab(longy['variable'],longy['value'], normalize='columns')

How to read this table is that in the observed data for small team Males Round 1, IdleSpeculation was Ranked #1 with a Brier Score of 0.1916. My simulations show that based on those prior estimates, IdleSpeculation takes the top prize the most often (column 0), but only 43% of the time. You can see that even the bottom score here by TeamSmith takes #1 in 10% of the simulations.

This shows that there is some signal in the leaderboard, if it was totally random each of the ranks would have ~25% in each outcome. But it is clearly far from certain though either. This only considers people on the leaderboard who I know their results. It could also easily be someone in 5,6,7 could even have swapped to the #1 results.

What can we learn from this? One, the leaderboard results are unlikely to signify substantively improved models between different competitors. Clearly IdleSpeculation did well across the entire competition, but it would be hard to argue they were clearly better than everyone else (e.g. IdleSpeculations #3 rank in females in round 1 I suspect is just as likely due to bad luck as it is to their model being substantively worse than TeamKlus or TeamSherill).

Two, I think it would be better for competitions like this for people to submit algorithms, and then the algorithms can be judged on various train/tests (or a grid search cross-validation, or whatever). Using a simple train/test split like this will always come with some noise in the rankings.

This also solves the issue with transparency. Currently NIJ is simply asking us to submit a paper saying how we did the results. It would be more transparent to force people to submit code to replicate the results 100% (as well as prevent any obvious cheating).

Prelim results for NIJ Recidivism Challenge

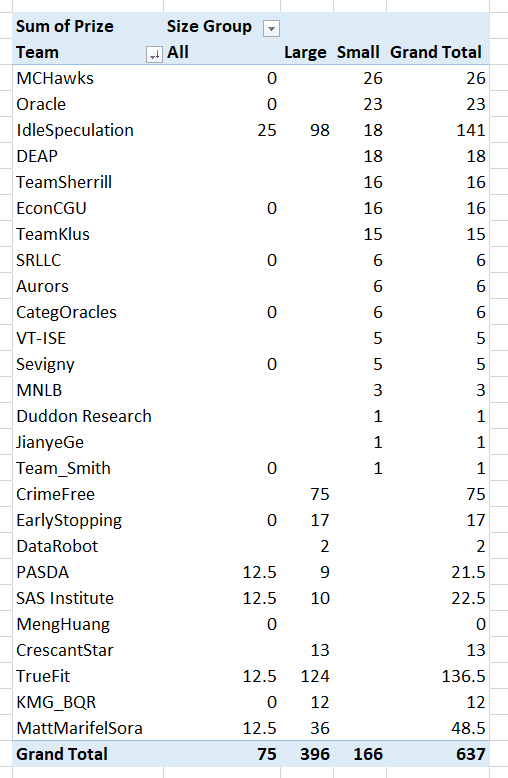
So the prelim results for the NIJ recidivism challenge are up. My team, MCHawks with Gio Circo, did ok. Here is a breakdown of team winnings (minus the student category) per 1k. So while we won the most in the small team category, IdleSpeculation overall kicked our butt!

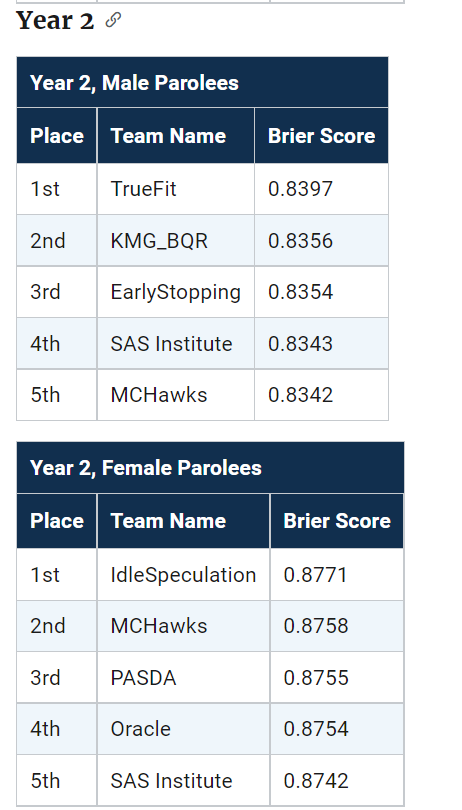
We actually biased our predictions to meet the racial fairness constraint, so you can see we did much better in those categories in Round 1 and Round 2. Unfortunately you only win if you get top in this category – no second place winners here (it says Brier score in these tables, but this is (1 - BrierScore)*(1 - FPDifference):

But we got lucky and won the overall in Round 2 despite biasing our predictions. Round 3 we have no excuse really, while the predictions were biased it did not matter.

We will do a paper for the results, but overall our approach is pretty standard. For each round we did a grid search over various models – for R1 and R3 we did a L1 logit, for R2 we did an XGBoost model. I did attempt a specialized Logit model with the fairness constraints in the loss function (and just used backpropogation to fit the model, ala deep learning), but in practice the way the fairness metric is done this just added noise into the estimate.

I will have more to say in the future about fairness metrics, unfortunately here I do not think it was well thought out. It was simply the false positive rate comparing white/black subgroups, assuming a threshold of 0.5, which does not make sense in practice. (I’ve written about calculating the threshold for bail here, it applies the same to parole though as well.) So for each model we simply clipped probabilities to be below 0.5 to meet this – no one predicted high means 0 false positives for each group.

So the higher threshold makes it silly, also the multiplication between the metrics I don’t think is a good idea either. I think it can be amended though to be a more reasonable additive fairness constraint. E.g. BrierScore + lambda*FPDifference, where lambda is a tuner to set how you want to make the tradeoff (and FP may be the total N difference, not a proportion difference, which can be volatile for small N). (Also I think it makes more sense to balance false negatives than false positives in the CJ example, but any algorithm to balance one can be flipped to balance the other.)

I do like how NIJ spreads prizes out, instead of Kaggle like with only 1/2/3 big prizes. I wish here we could submit two predictions though (one for main and one for fair). (I am pretty sure we would have placed in Year1 if we did not bias our predictions.)

Balancing False Positives

One area of prediction in criminal justice I think has alot of promise is using predictive algorithms in place of bail decisions. So using a predictive instrument to determine whether someone is detained pre-trial based on risk, or released on recognizance if you are low risk. Risk can be either defined as based on future dangerousness or flight risk. This cuts out the middle man of bail, which doesn’t have much evidence of effectiveness, and has negative externalities of placing economic burdens on folks we really don’t want to pile that onto. It is also the case algorithms can likely do quite a bit better than judges in figuring out future risk. So an area I think they can really do good compared to current status quo in the CJ system.

A reasonable critique of such systems though is they can have disparate racial impact. For example, ProPublica had an article on how the Compas risk assessment instrument resulted in more false positives for black than white individuals. Chris Stucchio has a nice breakdown for why this occurs, which is not due to the Compas being intrinsically racist algorithm, but due to the nature of the baseline risks for the two groups.

Consider a very simple example to illustrate. Imagine based on our cost-benefit analysis, we determine the probability threshold to flag a individual as high risk is 60%. Now say our once we apply our predictions, for those above the threshold, whites are all predicted to be 90%, and blacks are all 70%. If our model is well calibrated (which is typically the case), the false positive rate for whites will be 10%, and will be 30% for blacks.

It is actually a pretty trivial problem though to balance false positive rates between different groups, if that is what you want to do. So I figured I would illustrate here using the same ProPublica data. There are trade-offs though with this, balancing false positives means you lose out on other metrics of fairness. In particular, it means you don’t have equality of treatment – different racial groups will have different thresholds. The full data and code I use to illustrate this can be downloaded here.

An Example in Python

To illustrate how we would balance the false positive rates between groups, I use the same ProPublica risk assessment data. So this isn’t per se for bail decisions, but works fine as an illustration. First in python I load my libraries, and then read in the data – it is a few over 11,000 cases.

import pandas as pd
import os
import numpy as np
from sklearn.ensemble import RandomForestClassifier
import matplotlib.pyplot as plt

my_dir = r'C:\Users\andre\Dropbox\Documents\BLOG\BalanceFalsePos'
os.chdir(my_dir)

#For notes on data source, check out 
#https://github.com/apwheele/ResearchDesign/tree/master/Week11_MachineLearning
recid = pd.read_csv('PreppedCompas.csv')
print( recid.head() )

Next I prepare the dataset for modelling. I am not using all of the variables in the dataset. What I predict here is recidivism post 30 days (there are a bunch of recidivism right away in the dataset, so I am not 100% sure those are prior to screening). I use the three different aggregate compas scores, juvenile felony count, whether they were male, how old they were, and whether the current charge to precipitate screening is a felony or misdemeanor. I include the race variable in the dataset, but I won’t be using it in the predictive model. (That point deserves another blog post, contra to what you might expect, leaving race flags in will often result in better outcomes for that protected class.)

#Preparing the variables I want
recid_prep = recid[['Recid30','CompScore.1','CompScore.2','CompScore.3',
                    'juv_fel_count','YearsScreening']]
recid_prep['Male'] = 1*(recid['sex'] == "Male")
recid_prep['Fel'] = 1*(recid['c_charge_degree'] == "F")
recid_prep['Mis'] = 1*(recid['c_charge_degree'] == "M")
recid_prep['race'] = recid['race']
print( recid['race'].value_counts() ) #pretty good sample size for both whites/blacks

Next I make my testing and training sets of data. In practice I can perfectly balance false positives retrospectively. But having a test set is a better representation of reality, where you need to make some decisions on the historical data and apply it forward.

#Now generating train and test set
recid_prep['Train'] = np.random.binomial(1,0.75,len(recid_prep))
recid_train = recid_prep[recid_prep['Train'] == 1]
recid_test = recid_prep[recid_prep['Train'] == 0]

Now the procedure I suggest to balance false-positives doesn’t matter how you generate the predictions, just that we need a predicted probability. Here I use random forests, but you could use whatever machine learning or logistic regression model you want. Second part just generates the predicted probabilities for the training dataset.

#Now estimating the model
ind_vars = ['CompScore.1','CompScore.2','CompScore.3',
            'juv_fel_count','YearsScreening','Male','Fel','Mis'] #no race in model
dep_var = 'Recid30'
rf_mod = RandomForestClassifier(n_estimators=500, random_state=10)
rf_mod.fit(X = recid_train[ind_vars], y = recid_train[dep_var])

#Now getting the predicted probabilities in the training set
pred_prob = rf_mod.predict_proba(recid_train[ind_vars] )
recid_train['prob'] = pred_prob[:,1]
recid_train['prob_min'] = pred_prob[:,0]

Now to balance false positives, I will show a graph. Basically this just sorts the predicted probabilities in descending order for each racial group. Then you can calculate a cumulate false positive rate for different thresholds for each group.

#Making a cusum plot within each racial group for the false positives
recid_train.sort_values(by=['race','prob'], ascending=False, inplace=True)
recid_train['const'] = 1
recid_train['cum_fp'] = recid_train.groupby(['race'])['prob_min'].cumsum()
recid_train['cum_n'] = recid_train.groupby(['race'])['const'].cumsum()
recid_train['cum_fpm'] = recid_train['cum_fp'] / recid_train['cum_n']
white_rt = recid_train[recid_train['race'] == 'Caucasian']
black_rt = recid_train[recid_train['race'] == 'African-American' ] 

And now the fun part (and least in output, not really in writing matplotlib code).

#now make the chart for white and black
fig, ax = plt.subplots()
ax.plot(black_rt['prob'], black_rt['cum_fpm'], drawstyle='steps', color='b', label='Black')
ax.plot(white_rt['prob'], white_rt['cum_fpm'], drawstyle='steps', color='r', label='White')
ax.set_xlim(1, 0)  # decreasing probs
plt.xticks(np.arange(1.0,-0.1,-0.1))
ax.set_xlabel('Predicted Probability')
ax.set_ylabel('Mean False Positive Rate')
ax.grid(True,linestyle='--')
ax.legend(facecolor='white', framealpha=1)
plt.savefig('FP_Rate.png', dpi=2000, bbox_inches='tight')
plt.show()

So what this chart shows is that if we set our threshold to a particular predicted probability (X axis), based on the data we would expect a false positive rate (Y axis). Hence if we want to balance false positives, we just figure out the race specific thresholds for each group at a particular Y axis value. Here we can see the white line is actually higher than the black line, so this is reverse ProPublica findings, we would expect whites to have a higher false positive rate than blacks given a consistent predicted probability of high risk threshold. So say we set the threshold at 10% to flag as high risk, we would guess the false positive rate among blacks in this sample should be around 40%, but will be closer to 45% in the white sample.

Technically the lines can cross at one or multiple places, and those are places where you get equality of treatment and equality of outcome. It doesn’t make sense to use that though from a safety standpoint – those crossings can happen at a predicted probability of 99% (so too many false negatives) or 0.1% (too many false positives). So say we wanted to equalize false positive rates at 30% for each group. Here this results in a threshold for whites as high risk of 0.256, and for blacks a threshold of 0.22.

#Figuring out where the threshold is to limit the mean FP rate to 0.3
#For each racial group
white_thresh = white_rt[white_rt['cum_fpm'] > 0.3]['prob'].max()
black_thresh = black_rt[black_rt['cum_fpm'] > 0.3]['prob'].max()
print( white_thresh, black_thresh )

Now for the real test, lets see if my advice actually worked in a new sample of data to balance the false positive rate.

#Now applying out of sample, lets see if this works
pred_prob = rf_mod.predict_proba(recid_test[ind_vars] )
recid_test['prob'] = pred_prob[:,1]
recid_test['prob_min'] = pred_prob[:,0]

white_test = recid_test[recid_test['race'] == 'Caucasian']
black_test = recid_test[recid_test['race'] == 'African-American' ]

white_test['Flag'] = 1*(white_test['prob'] > white_thresh)
black_test['Flag'] = 1*(black_test['prob'] > black_thresh)

white_fp= 1 - white_test[white_test['Flag'] == 1][dep_var].mean()
black_fp = 1 - black_test[black_test['Flag'] == 1][dep_var].mean()
print( white_fp, black_fp )

And we get a false positive rate of 54% for whites (294/547 false positives), and 42% for blacks (411/986) – yikes (since I wanted a 30% FPR). As typical, when applying your model to out of sample data, your predictions are too optimistic. I need to do some more investigation, but I think a better way to get error bars on such thresholds is to do some k-fold metrics and take the worst case scenario, but I need to investigate that some more. The sample sizes here are decent, but there will ultimately be some noise when deploying this in practice. So basically if you see in practice the false positive rates are within a few percentage points that is about as good as you can get in practice I imagine. (And for smaller sample sizes will be more volatile.)