Upcoming at the American Society of Evidence Based Policing Conference, I have a talk Thursday morning (9:45-10:00), How long to conduct your experiment.
The talk goes over some of the simple metrics I have created to help plan how long to conduct your intervention. Such as how long to evaluate your hot spots intervention, or purchase to increase arrest rates, etc.
I have prepared a ton of different resources. The main one is a web-based application (a WASM-based app with R as the backend) where you can enter your inputs and generate a graph showing how precise your parameter estimates are:
The help page includes citations and additional materials, but here is a brief rundown:
I have the math details in this github repo, see the methodology.pdf. It also includes notes on how I used different LLM tools to produce the webpage and the method materials. Each of the applications allows you to download the R code used to generate the graphs and tables.
I have created a series of YouTube videos demonstrating the application (WDD, IRR, Proportion tests)
One of the questions I often ask in data science interviews is ‘How would you explain the area under the curve statistic to a business person?’. Maybe it is too easy a question even for juniors, as I can’t remember anyone getting it wrong. While there is no correct answer per se, the most logical response is you focus on discussing true positives and false positives, and how the predictive model can be tuned to capture more true positives at the expense of generating more false positives. Only after that do you then even bother to show the ROC curve, and say we calculate the area under the curve (AUC) as a measure of how well the model can discriminate the two classes.
The most recent situation I remember this happened in real life, I actually said to the business rep that the AUC does not directly translate to revenue, but is a good indication that a model is good in an absolute sense (we know others have AUCs typically around 0.7 to 0.8 for this problem, and over 0.5 is better than random). And it is often good in a relative sense – a model with an AUC of 0.8 is typically better than a model with and AUC of 0.75 (although not always, you need to draw the ROC curve and make sure the larger AUC curve dominates the other curve and that they do not cross). So while I try to do my best explaining technical statistical content, I often punt to simpler ‘here are the end outcomes we care about’ (which don’t technically answer the question) as opposed to ‘here is how the sausage is made’ explanations.
One alternative and simple explanation of AUC though for binary models is to take the Harrell’s C index interpretation, which for binary predictions is equivalent to the AUC statistic. So for this statistic you could say something like ‘If I randomly sample a negative case and a positive case, the positive case will have a higher predicted risk {AUC} percent of the time.’ I do like this interpretation, which illustrates that the AUC is all just about rank ordering the predictions, and a more discriminating model will have a higher AUC (although it says nothing about calibration).
This Thursday 11/19/2020 at 1 PM Eastern, I will be participating in a roundtable for the online CrimCon event. This is free for everyone to zoom in, and here is the link to the program, I am on Stream 3!
The title is above — I have been a private sector data scientist at HMS for not quite a year now. I wanted to organize a panel to help upcoming PhD’s in criminal justice get some more exposure to potential data science positions, outside the traditional tenure track. Here is the abstract:
Tenure-track positions in academia are becoming more challenging to obtain, and only a small portion of junior faculty continue in academia to the rank of full professor. Therefore, students may opt to explore alternate options to obtain employment after their PhD is finished. These alternatives to the tenure track are often called “alt-academic” jobs. This roundtable will be focused on discussing various opportunities that exist for PhD’s in criminal justice and behavioral sciences spanning the public sector, the private sector, and non-profits/think tanks. Panelists will also discuss gaps in the typical PhD curriculum, with the goal of aiding current students to identify steps they can take to make themselves more competitive for alt-academic roles.
And here are each of the panelists bios:
Dr. Andrew Wheeler is currently a Data Scientist at HMS working on problems related to predictive modeling and optimization in relation to health insurance claims. Before joining HMS, he received a PhD degree in Criminal Justice from SUNY Albany. While in academia his research focused on collaborating with police departments for various problems including; evaluating crime reduction initiatives, place based and person based predictive modeling, data analytics for crime analysis, and developing models for the efficient and fair delivery of police resources.
Dr. Jennifer Gonzalez is the Senior Director of Population Health at the Meadows Mental Health Policy Institute, where she manages the Institute’s research and data portfolio. She earned her doctoral degree in epidemiology and a M.S. degree in criminal justice. Before joining MMHPI, Dr. Gonzalez was a tenured associate professor at the University of Texas School of Public Health, where she maintained a portfolio of more than $10 million in research funding and published more than one hundred interdisciplinary articles focused on the health of those who come into contact with—and work within—the criminal justice system.
Dr. Kyleigh Clark-Moorman is a Senior Research Associate for the Public Safety Performance Project at The Pew Charitable Trusts, a non-profit public policy organization. Kyleigh began working at Pew in 2019 and completed her PhD in Criminology and Criminal Justice at the University of Massachusetts, Lowell in May 2020. As an early career researcher, Dr. Clark-Moorman’s work has been published in Criminal Justice and Behavior, Criminal Justice Studies, and the Journal of Criminal Justice. In her role at Pew, Kyleigh is responsible for research design and data analysis focused on various criminal justice topics while also working with external partners to produce high-impact reports and analyses to raise awareness and drive public policy.
Matt Vogel is Associate Professor in the School of Criminal Justice at the University at Albany, SUNY and the Director of the Laboratory for Decision Making in Criminology and Criminal Justice. Matt regularly assists local agencies with data and evaluation needs. Some of his ongoing collaborations include assessments of racial representation on capital juries in Missouri, a longitudinal evaluation of a school-based violence reduction program, and the implementation of a police-hospital collaboration to help address retaliatory violence in St. Louis. Prior to joining the faculty at UAlbany, Matt worked in the Department of Criminology and Criminal Justice at the University of Missouri – St. Louis and held a long-term visiting appointment with the Faculty of Architecture at TU Delft (the Netherlands).
If you have any upfront questions you would like addressed by the panel, always feel free to send me a pre-emptive email (or comment below).
Update: The final roundtable is now posted on Youtube. See below for the panels thoughts on pursuing non-tenure track jobs with your social science Phd.
At the upcoming American Society of Criminology conference in Philadelphia I will be presenting a talk, Crime Data Visualization for the Future. Here is the abstract:
Open data is a necessary but not sufficient condition for data to be transparent. Understanding how to reduce complicated information into informative displays is an important step for those wishing to understand crime and how the criminal justice system works. I focus the talk on using simple tables and graphs to present complicated information using various examples in criminal justice. Also I describe ways to effectively evaluate the size of effects in regression models, and make black box machine learning models more interpretable.
But I have written a paper to go with the talk as well. You can download that paper here. As always, if you have feedback/suggestions let me know.
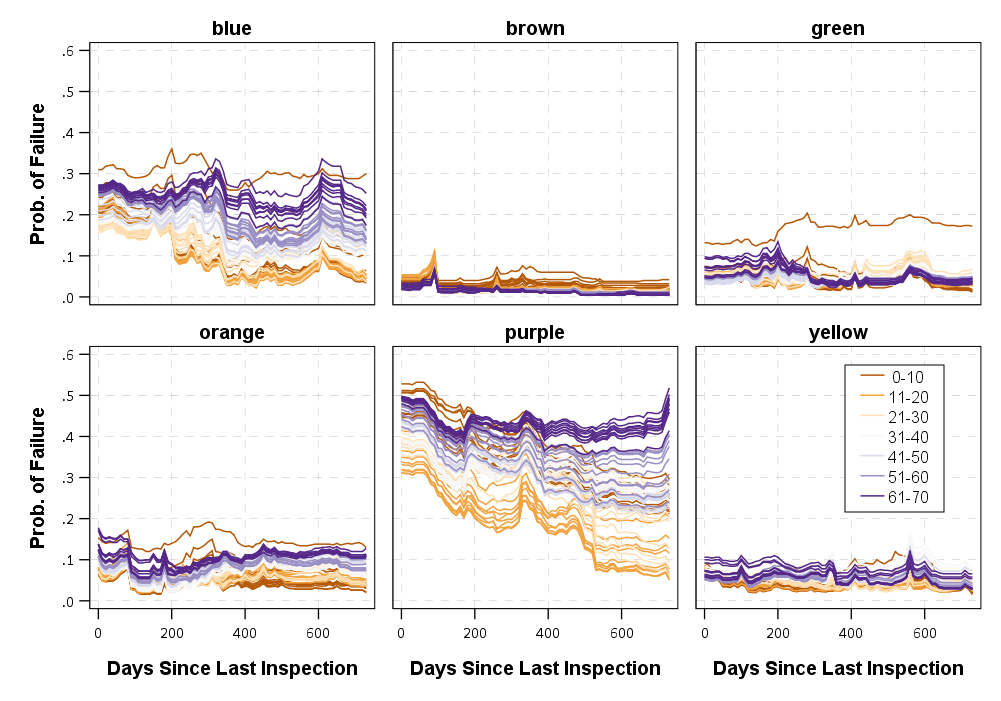
Here are some example graphs of plotting the predictions from a random forest model predicting when restaurants in Chicago will fail their inspections.
I present on Wednesday 11/15 at 11 am. You can see the full session here. Here is a quick rundown of the other papers — Marcus was the one who put together the panel.
A Future Proposal for the Model Crime Report – Marcus Felson
Crime Data Warehouses and the future of Big Data in Criminology – Martin Andresen
Can We Unify Criminal Justice Data, Like the Dutch and the Nordics? – Michael Mueller-Smith
So it should be a great set of talks.
I also signed up to present a poster, Mapping Attitudes Towards the Police at Micro Places. This is work with Albany Finn Institute folks, including Jasmine Silver, Sarah McLean, and Rob Worden. Hopefully I will have a paper to share about that soon, but for a teaser on that here is an example map from that work, showing hot spots of dissatisfaction with the police estimated via inverse distance weighting. Update: for those interested, see here for the paper and here for the poster. Stop on by Thursday to check it out!
And here is the abstract:
We demonstrate the utility of mapping community satisfaction with the police at micro places using data from citizen surveys conducted in 2001, 2009 and 2014 in one city. In each survey, respondents provided the nearest intersection to their address. We use inverse distance weighting to map a smooth surface of satisfaction with police over the entire city, which shows broader neighborhood patterns of satisfaction as well as small area hot spots of dissatisfaction. Our results show that hot spots of dissatisfaction with police do not conform to census tract boundaries, but rather align closely with hot spots of crime and police activity. Models predicting satisfaction with police show that local counts of violent crime are the strongest predictors of attitudes towards police, even above individual level predictors of race and age.
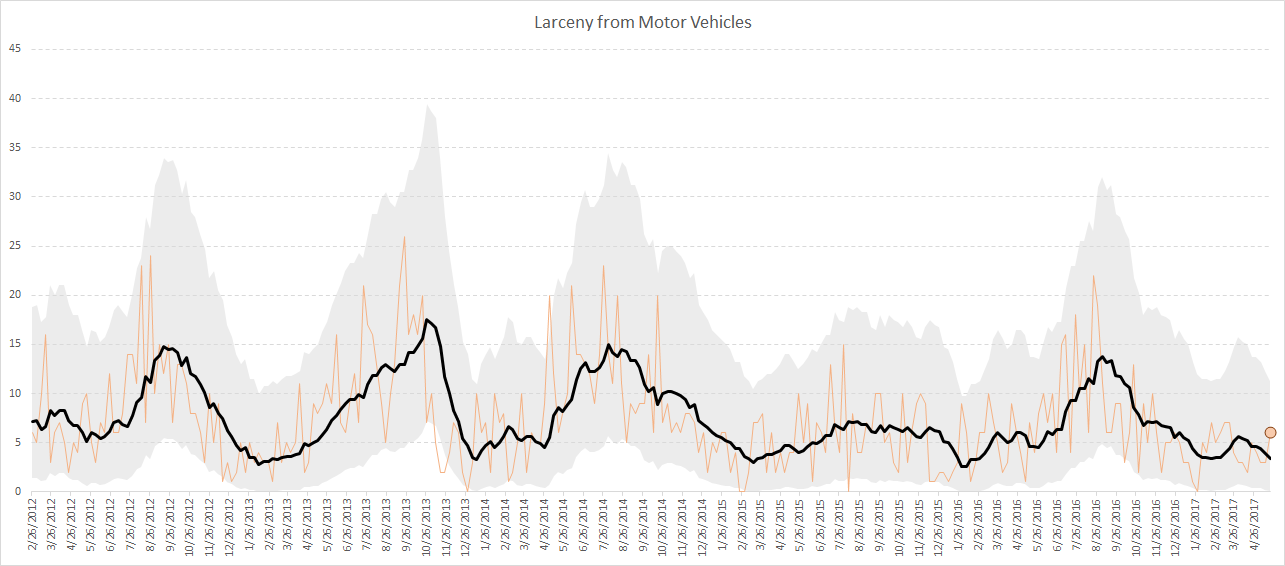
For some preview, I will show how to make a weekly smoothed chart with error bands:
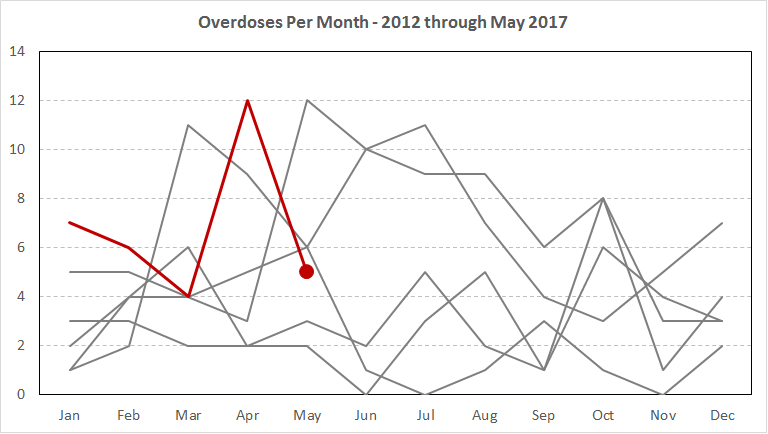
As well as a monthly seasonal chart:
I use Excel not because I think it is the best tool, but mainly because I think it is the most popular among crime analysts. In the end I just care about getting the job done! (Although I’ve given reasons why I think Excel is more painful than any statistical program.) Even though it is harder to make small multiple charts in Excel, I show how to make these charts using pivot tables and filters, so watching them auto-update when you update the filter is pretty cool.
For those with SPSS I have already illustrated how to make similar charts in SPSS here. You could of course replicate that in R or Stata or whatever if you wanted.
I am on the preliminary schedule currently for Tuesday, September 12th at 13:30 to 14:45. I will be in New Orleans on the 11th, 12th and 13th, so if you want to meet always feel free to send an email to set up a time.
This year at the American Society of Criminology I will be presenting some work from my dissertation, Quantifying the Local and Spatial Effects of Alcohol Outlets on Crime. I have the working paper posted on SSRN, and that also has a link to download data and code to reproduce the findings in the paper.
I will be presenting at the panel Alcohol and Crime on Wednesday at 9:30 (at the Cambridge room on the 2nd level).
Here is the abstract:
This paper estimates the relationship between alcohol outlets and crime at micro place street units in Washington, D.C. Three specific additions to this voluminous literature are articulated. First, the diffusion effect of alcohol outlets is larger than the local effect. This has important implications for crime prevention. The second is that in this sample the effects of on-premise and off-premise outlets are very similar in magnitude. I argue this is evidence in favor of routine activities theory, in opposition to theories which emphasize individual alcohol consumption. The final is that alcohol outlets have large effects on burglary, despite the fact that alcohol outlets cannot increase the number of vulnerable targets, as it can with interpersonal crimes. I discuss how this can either be interpreted as evidence that alcohol outlets self-select into already crime prone areas, or potentially that the presence of motivated offenders’ matters much more than increasing the number of potential victims.
The most interesting finding is the fact that I estimate the diffusion effect of alcohol outlets is larger than the local effect. I then show that this is the case for some other papers as well, it is just interpreting the regression model is tricky. Here is a diagram showing what happens. The idea is the regression coefficient for the spatial lag is one orange dot, and the local effect is the blue dot. Adding a bar though diffuses to multiple places, so when adding up all the smaller orange dots, they result in more crime than the one bigger blue dot.
I will be presenting at the ACJS (Academy of Criminal Justice Sciences) conference in Denver in a few days. My talk will be on some of the work I have been conducting with the Albany Police Department via the Finn Institute (Rob Worden and Sarah McLean are co-authors on the presentation). The title is Making stops smart: Predicting arrest rates from discretionary police stops at micro places in Albany, NY and here is the abstract:
Police stops are one of the most invasive, but regularly used crime control tactics by police. Similar to how focusing police resources at hot spots of crime can improve police efficiency, here we examine the spatial variation in arrest rates at micro places (street segments and intersections) in Albany, NY. Using data from over 240,000 discretionary police stops, we fit random effects logistic regression models to predict the probability of an arrest at different micro places. We show that like hot spots, there are examples of high arrest rate locations next to low arrest rate locations. Using a simulation, we show that if one displaced stops from low arrest locations to high arrest locations, one could make half as many stops but still have the same number of total arrests.
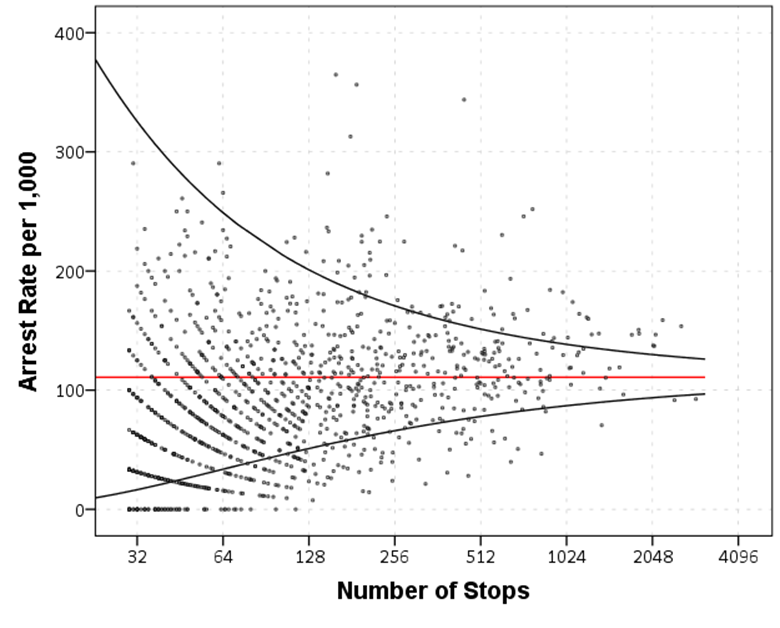
Here is a funnel chart of the arrest hit rates at micro-places across the city. You can see quite a bit of extra variation in arrest rates to attempt to explain.
I am giving this at 8 am on Thursday (see Event #185 in the program)
There will be two other presentations at the moment (Ling Wu is not going to make it), and they are:
Results from a victim generated crime mapping software, Zavin Nazaretian et al. – Indiana University of PA
Spatial analysis of aggravated assault and homicide crime scene, arrest and offender residence locations in Houston, TX, Elishewah Weisz – Sam Houston
So if you are interested in crime mapping stuff it should be a good session.
Feel free to bug me if you see me around at ACJS.
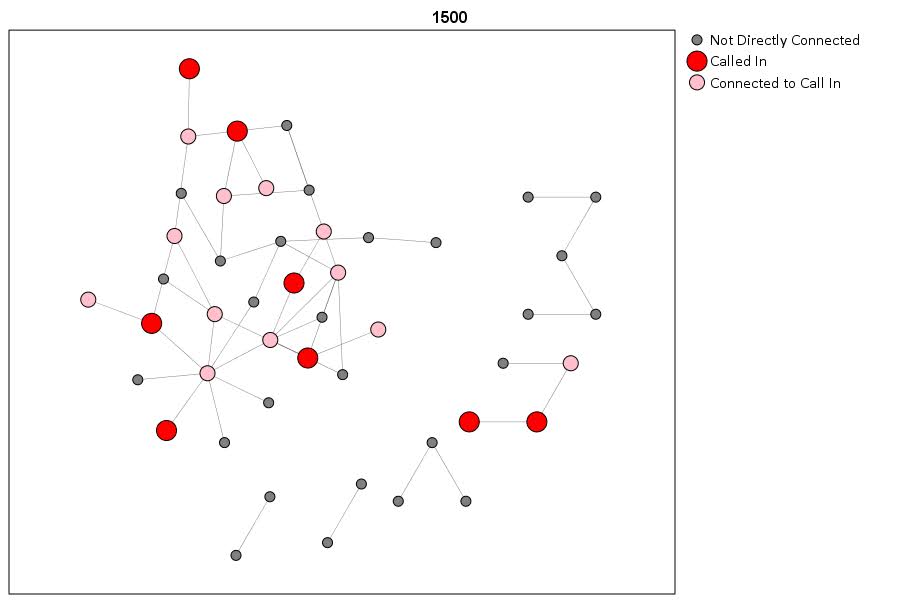
Also before I forget, my co-workers are presenting a poster on analysis of Syracuse Truce – a focused deterrence gang intervention. The posters are on Friday, so I won’t be around unfortunately. The title is Gangs, groups, networks, and deterrence: An evaluation of Syracuse Truce. (See poster #45 in the same program I linked to earlier.) Rob and Kelly will at least be manning the poster though – so you can go and bug them about the details!
Here is a picture of the reach of call-ins for one particular gang. The idea is for those who attended call ins to spread the message to other members. So this graph evaluates how well the call-ins would be expected to reach all of the members of the gang.
If you are wondering what I do for my job – yes I pretty much just make maps and graphs all day long 😉
Part of the work I am doing with the Finn Institute in collaboration with the Albany Police Department was accepted as a presentation at the upcoming IACA conference in Seattle next week. The NIJ used to have a separate Crime Mapping conference, but they folded it into the yearly IACA conference. So this is one of the NIJ Crime Mapping presentations.
The title of the presentation is Making Field Stops Smart, and below is the abstract:
Mapping hot spots of crime incidents for use in allocating patrol resources has become commonplace. This research is intended to extend the logic to mapping locations of field interviews. The project has two specific spatial analysis components; 1) are most of the stops being conducted a high crime locations, and 2) are locations with the most stops the locations with the most productive stops (in terms of arrests, contraband recovery, stopping chronic offenders). Making stops smart is being conducted as a research partnership between the Albany, NY police department and the Finn Institute of Public Safety.
The time of the presentation is at 15:30 on Thursday 9/11. Two other presenters, Eric Paull from Akron, Ohio and Christian Peterson from Portland, Oregon have presentations on the panel as well (see the IACA agenda for their talk abstracts).
I am uncomfortable publicly releasing the pre-print white papers given the collaboration (Rob Worden and Sarah McLean are co-authors) and because that APD’s name is directly attached to the work. But if you send me an email I can forward the white paper for this presentation and related work we are doing.
If you see me at IACA feel free to come up and say hi. I do not have any other plans while I am in town besides going to presentations.
The defense date for my prospectus, What we can learn from small units of analysis, is finally set, November 1st at 9:30 (location TBD). You can find an electronic copy of the prospectus here and below is the abstract. So bring your slings and arrows (and I’ll bring some hydrogen peroxide and gauze?)
What we can learn from small units of analysis Andrew Wheeler Prospectus Defense 11/1/2013
The dissertation is aimed at advancing knowledge of the correlates of crime at small geographic units of analysis. I begin the prospectus by detailing what motivates examining crime at small places, and focus on how aggregation creates confounds that limit causal inference. Local and spatial effects are confounded when using aggregate units, so to the extent the researcher wishes to distinguish between these two types of effects it should guide what unit of analysis is chosen. To illustrate these differences, I propose data analysis to examine local, spatial and contextual effects for bars, broken windows and crime using publicly available data from Washington D.C. I also propose a second set of data analysis focusing on estimating the effects of various measures of the built environment on crime.
The preliminary program for the American Society of Criminology meeting (this November in Atlanta) is up and my scheduled presentation time is 3:30 on Wednesday Nov. 20th. The title of my talk is Visualization Techniques for Journey to Crime Flow Data, and the associated pre-print is available on SSRN.
The title of the panel is Spatial and Temporal Analysis (a bit of a hodge podge I know), and is being held at Room 8 at the international level. The other presentations are;
Analyzing Spatial Interactions in Homicide Research Using a Spatial Durbin Model by Matthew Ruther and John McDonald (UPenn Demography and Criminology respectively)
Space-time Case-control Study of Violence in Urban Landscapes by Douglas Wiebe et al. (Some more folks from UPenn but not from the Criminology dept.!)
Spatial and Temporal Relationships between Violence, Alcohol Outlets and Drug Markets in Boston, 2006-2010 by Robert Lipton et al. (UMich Injury Center)
So come to see the other presenters (and stay for mine)! If anyone would like to meet up during the conference, feel free to shoot me an email. If I don’t cut my hair in the meantime maybe me and Robert Lipton can start a craziest hair for ASC award.
Note, I have no idea who the panel chair is, so perhaps we are still open for volunteers for that job.