A latent variable approach to RTM using hidden layers in deep learning

Sorry about the long title! Previously I have blogged about how to use Deep Learning to generate an RTM like model variable selection and positive constraints. Deep learning frameworks often do not rely on variable selection like that though, they more often leverage hidden layers. For social scientists familiar with structural equation modelling, these hidden layers are very much akin to formative latent variables. (More traditionally folks use reflective latent variables in factor analysis, so the latent variable causes the observed measures. This is the obverse, the observed measures cause/define the latent variable, and we find the loadings that best predict some outcome further down the stream.)

In a nutshell, instead of the typical RTM way of picking the best variable to use, e.g. Alcohol Density < 100 meters OR Alcohol Density < 500 meters, it allows both to contribute to a latent variable, call it AlcoholDens, but allows those weights to vary. Then I see how well the AlcoholDens latent variable predicts crime. I will show later in the results that the loadings are often spread out among different density/distance measures in this sample, suggesting the approach just pick one is perhaps misguided.

I’ve posted the data and code to follow along here. There are two py files, 00_RTMHidden.py runs the main analysis, but dl_rtm_funcs.py has various functions used to build the deep learning model in pytorch. I am just going to hit some of the highlights instead of walking through bit by bit.

Some helper functions

First, last blog post I simply relied on using Poisson loss. This time, I took some effort to figure out my own loss function for the negative binomial model. Here I am using the NB2 form, and you can see I took the likelihood function from the Stata docs (they are a really great reference for various regression model info). To incorporate this into your deep learning model, you need to add a single parameter in your model, here I call it disp.

#Log likelihood taken from Stata docs, pg 11 
#https://www.stata.com/manuals13/rnbreg.pdf
def nb2_loss(actual, log_pred, disp):
    m = 1/disp.exp()
    mu = log_pred.exp()
    p = 1/(1 + disp.exp()*mu)
    nll = torch.lgamma(m + actual) - torch.lgamma(actual+1) - torch.lgamma(m)
    nll += m*torch.log(p) + actual*torch.log(1-p)
    return -nll.mean()

A second set of helper functions I will illustrate at the end of the post is evaluating the fit for Poisson/Negative Binomial models. I’ve discussed these metrics before, they are just a python rewrite of older SPSS code I made.

def pred_nb(mu, disp, int_y):
    inv_disp = 1/disp
    p1 = gamma(int_y + inv_disp) / ( factorial(int_y)*gamma(inv_disp) )
    p2 = ( inv_disp / (inv_disp + mu) ) ** inv_disp
    p3 = ( mu / (inv_disp + mu) ) ** int_y
    pfin = p1*p2*p3
    return pfin
    
def nb_fit(mu, obs, disp, max_y):
    res = []
    cum_fit = mu - mu
    for i in range(max_y+1):
        pred_fit = pred_nb(mu=mu, disp=disp, int_y=i)
        pred_obs = (obs == i)
        res.append( (str(i), pred_obs.mean(), pred_fit.mean(), pred_obs.sum(), pred_fit.sum()) )
        cum_fit += pred_fit
    fin_fit = 1 - cum_fit
    fin_obs = (obs > max_y)
    res.append( (str(max_y+1)+'+', fin_obs.mean(), fin_fit.mean(),
                  fin_obs.sum(), fin_fit.sum()) )
    dat = pd.DataFrame(res, columns=['Int','Obs','Pred','ObsN','PredN'])
    return dat

Main Analysis

Now onto the main analysis. Skipping the data loading (it is near copy-paste from my prior RTM Deep Learning post), here are the main guts to building and fitting the RTM model.

model = dl_rtm_funcs.RTM_hidden(gen_list=[alc_set,metro_set,c311_set], 
                                gen_names=['AlcOutlets','MetroEntr','Dens311'])
optimizer = torch.optim.Adam(model.parameters(), lr=0.001) #1e-4

for t in range(5001):
    #Forward pass
    y_pred = model(comb_ten)
    #Loss 
    loss_insample = dl_rtm_funcs.nb2_loss(y_ten, y_pred, model.dispersion)
    optimizer.zero_grad()
    loss_insample.backward() #retain_graph=True
    optimizer.step()
    if t % 100 == 0:
        loss_out = dl_rtm_funcs.nb2_loss(out_ten, y_pred, model.dispersion)
        print(f'iter {t}: loss in = {loss_insample.item():.5f}, loss out = {loss_out.item():.5f}')

And in terms of iterations, on my machine this takes less than 20 seconds to do the 5000 iterations, and it has clearly peaked out by then (both in sample 2011 and out of sample 2012).

I’ve loading the RTM model object with a few helper functions, so if you then run print( model.coef_table() ), you get out the final regression coefficients, including the dispersion term. For my negative binomial models for my dissertation, the dispersion term tended to be around ~4 for many models, so this corresponds pretty closely with my prior work.

These have interpretations as latent variables representing the effect of nearby alcohol outlets (both distance and density), metro entrances (just distance), and 311 calls for service (just density). Similar to original RTM, I have restricted the crime generator effects to be positive.

I also have another helper function, model.loadings(), that gives you a nice table. Here this shows how the original variables contribute to the latent variable. So here are the loadings for the distance to the nearest metro.

You can see that the dummy variables for met_dis_300 (meters) and smaller all contribute to the latent variable. So instead of picking one variable in the end, it allows multiple variables to contribute to the latent risk score. It may make more sense in this set up to encode variables as not cumulative, e.g. < 50 meters, < 100 meters, but orthogonal, e.g. [0,50),[50,100), etc.), but just stuck with the prior data in the same format for now. I force the loadings to sum to 1 and be positive, so the latent variables still have a very apples-to-apples comparison in terms of effect sizes.

Here are the loadings for alcohol outlets, so we have both some distance and density effects in the end.

And here are the loadings for 311 density variables:

So you can see for the last one, only the furthest away had an effect at all. Which is contra to the broken windows theory! But also shows that this is more general than the original RTM approach. If it only should be one variable the model will learn that, but if it should be more it will incorporate a wider array of weights.

Next is to check out how well the model does overall. For calibration for Poisson/Negative Binomial models, I just detach my pytorch tensors, and feed them into my functions to do the evaluations.

#Calibration for Negative Binomial predictions
pred_pd = pd.Series( y_pred.exp().detach().numpy() )
disp_val = model.dispersion.exp().item()

nb_fit = dl_rtm_funcs.nb_fit(mu=pred_pd, obs=crime_data['Viol_2011'], 
                             disp=disp_val, max_y=10)
print( nb_fit )

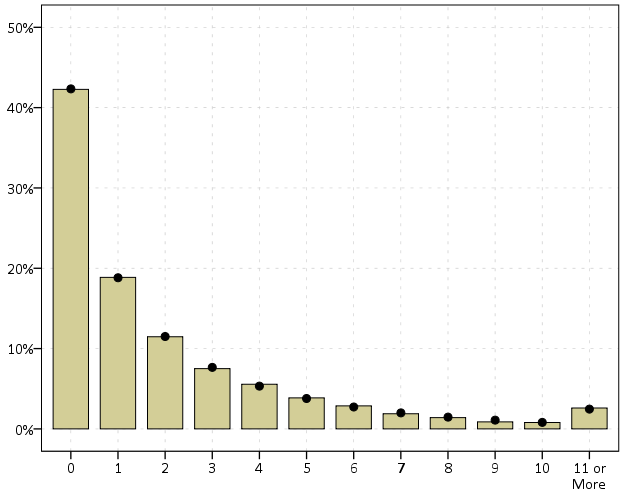
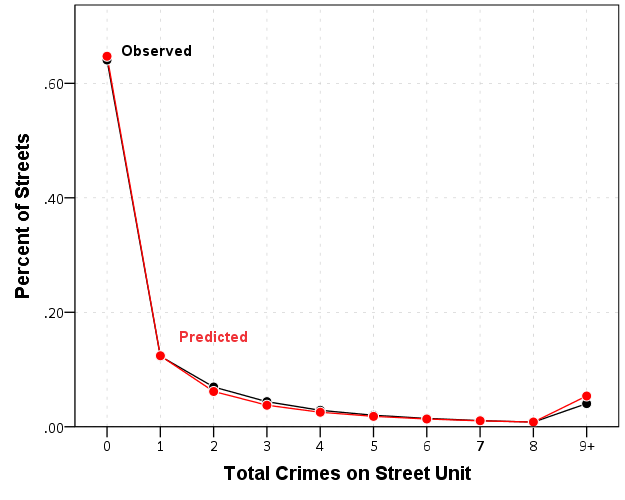
So this shows that the model is pretty well calibrated in terms of overall predictions. Both samples predict 83% zeroes. I predict a few more 3/4 crime areas than observed, and my tails are somewhat thinner than they should be, but only by a tiny bit. (No doubt this would improve if I incorporated more covariates, kept it simple to debug on purpose.)

We can ignore the negative binomial dispersion term and see what our model would predict in the usual Poisson case (the mean functions are the same, it is just changing the variance). To do this, just pass in a dispersion term of 1.

pois_fit = dl_rtm_funcs.nb_fit(mu=pred_pd, obs=crime_data['Viol_2011'], 
                               disp=1, max_y=10)
print( pois_fit )

You can see that the Poisson model is a much worse fit. Underpredicting zero crime areas by 6%, and areas with over 10 crimes should pretty much never happen according to the Poisson model.

We should be assessing these metrics out of sample as well, and you can see that given crime is very historically stable, the out of sample 2012 violent crime counts are similarly well calibrated.

Finally, I have suggested in the past to use a weighted ROC curve as a metric for crime counts. Here is a simple example of doing that in python.

crime_data['Weights'] = crime_data['Viol_2012'].clip(1)
crime_data['Outcome'] = crime_data['Viol_2012'].clip(0,1)

fpr, tpr, thresh = roc_curve(crime_data['Outcome'], pred_pd, sample_weight=crime_data['Weights'])
weighted_auc = auc(fpr, tpr)
print( weighted_auc ) 

So you can see the AUC is nothing to brag about here, 0.61 (it is only 0.63 in the 2011 sample). But again I am sure I could get that up by quite a bit by incorporating more covariates into the model.

Translating between the dispersion term in a negative binomial regression and random variables in SPSS

NOTE!! – when I initially posted this I was incorrect, I thought SPSS listed the dispersion term in the form of Var(x) = mean + mean*dispersion. But I was wrong, and it is Var(x) = 1 + mean*dispersion (the same as Stata’s, what Cameron and Trivedi call the NB2 model, as cited in the Long and Freese Stata book for categorical variables.) The simulation in the original post worked out because my example I used the mean as 1, here I update it to have a mean of 2 to show the calculations are correct. (Also note that this parametrization is equivalent to Var(x) = mean*(1 + mean*dispersion), see Stata’s help for nbreg.)

When estimating a negative binomial regression equation in SPSS, it returns the dispersion parameter in the form of:

Var(x) = 1 + mean*dispersion

When generating random variables from the negative binomial distribution, SPSS does not take the parameters like this, but the more usual N trials with P successes. Stealing a bit from the R documentation for dnbinom, I was able to translate between the two with just a tedious set of algebra. So with our original distribution being:

Mean = mu
Variance = 1 + mu*a

R has an alternative representation closer to SPSS’s based on:

Mean = mu
Variance = mu + mu^2/x

Some tedious algebra will reveal that in this notation x = mu^2/(1 - mu + a*mu) (note to future self, using Solve in Wolfram Alpha could have saved some time, paper and ink). Also, R’s help for dbinom states that in the original N and P notation that p = x/(x + mu). So here with mu and a (again a is the dispersion term as reported by GENLIN in SPSS) we can solve for p.

x = mu^2/(1 - mu + a*mu)
p = x/(x + mu)

And since p is solved, R lists the mean of the distribution in the N and P notation as:

n*(1-p)/p = mu

So with p solved we can figure out N as equal to:

mu*p/(1-p) = n

So to reiterate, if you have a mean of 2 and dispersion parameter of 4, the resultant N and P notation would be:

mu = 2
a = 4
x = mu^2/(1 - mu + a*mu) = 2^2/(1 - 2 + 4*2) = 4/7
p = x/(x + mu) = (4/7)/(4/7 + 2) = 2/9
n = mu*p/(1-p) = 2*(2/9)/(7/9) = 4/7

Here we can see that in the N and P notation the similar negative binomial model results in a fractional number of successes, which might be a surprising result for some that it is even a possibility. (There is likely an easier way to do this translation, but forgive me I am not a mathematician!)

Now we would be finished, but unfortunately SPSS’s negative binomial random functions only take integer values and do not take values of N less than 1 (R’s dnbinom does). So we have to do another translation of the N and P notation to the gamma distribution to be able to draw random numbers in SPSS. Another representation of the negative binomial model is a mixture of Poisson distributions, with the distribution of the mixtures being from a gamma distribution. Wikipedia lists a translation from the N and P notation to a gamma with shape = N and scale = P/(1-P).

So I wrapped these computations up in an SPSS macros that takes the mean and the dispersion parameter, calculates N and P under the hood, and then draws a random variable from the associated negative binomial distribution.

DEFINE !NegBinRV (mu = !TOKENS(1)
       /disp = !TOKENS(1) 
       /out = !TOKENS(1) )
COMPUTE #x = !mu**2/(1 - !mu + !disp*!mu).
COMPUTE #p = #x / (#x + !mu).
COMPUTE #n = !mu*#p/(1 - #p).
COMPUTE #G = RV.GAMMA(#n,#p/(1 - #p)).
COMPUTE !Out = RV.POISSON(#G).
FORMATS !Out (F5.0).
!ENDDEFINE.

I am not sure if it is possible to use this gamma representation and native SPSS functions to calculate the corresponding CDF and PDF of the negative binomial distribution. But we can use R to do that. Here is an example of keeping the mean at 1 and varying the dispersion parameter between 0 and 5.

BEGIN PROGRAM R.
library(ggplot2)
x <- expand.grid(0:10,1:5)
names(x) <- c("Int","Disp")
mu <- 1
x$PDF <- mapply(dnbinom, x=x$Int, size=mu^2/(1 - mu + x$Disp*mu), mu=mu)
#add in poisson 
t <- data.frame(cbind(0:10,rep(0,11),dpois(0:10,lambda=1)))
names(t) <- c("Int","Disp","PDF")
x <- rbind(t,x)
p <- ggplot(data = x, aes(x = Int, y = PDF, group = as.factor(Disp))) + geom_line()
p
#for the CDF
x$CDF <- ave(x$PDF, x$Disp, FUN = cumsum) 
END PROGRAM.

Here you can see how the larger dispersion term can easily approximate the zero inflation typical in criminal justice data (see an applied example from my work). R will not take a dispersion parameter of zero in this notation (as the size would be divided by zero and not defined), so I just tacked on the Poisson distribution with a mean of zero.

Here is an example of generating random data from a negative binomial distribution with a mean of 2 and a dispersion parameter of 4. I then grab the PDF from R, and superimpose them both on a chart in SPSS (or perhaps I should call it a PMF, since it only has support on integer values). You can see the simulation with 10,000 observations is a near perfect fit (so a good sign I did not make any mistakes!)

*Simulation In SPSS.
INPUT PROGRAM.
LOOP Id = 1 TO 10000.
END CASE.
END LOOP.
END FILE.
END INPUT PROGRAM.
DATASET NAME RandNB.

!NegBinRV mu = 2 disp = 4 out = NB.

*Making seperate R dataset of PDF.
BEGIN PROGRAM R.
mu <- 2
disp <- 4
x <- 0:11
pdf <- dnbinom(x=x,size=mu^2/(1 - mu + disp*mu),mu=mu)
#add in larger than 10
pdf[max(x)+1] <- 1 - sum(pdf[-(max(x)+1)])
MyDf <- data.frame(cbind(x,pdf))
END PROGRAM.
EXECUTE.
STATS GET R FILE=* /GET DATAFRAME=MyDf DATASET=PDF_NB.
DATASET ACTIVATE PDF_NB.
FORMATS x (F2.0).
VALUE LABELS x 11 '11 or More'.

*Now superimposing bar plot and PDF from separate datasets.
DATASET ACTIVATE RandNB.
RECODE NB (11 THRU HIGHEST = 11)(ELSE = COPY) INTO NB_Cat.
FORMATS NB_Cat (F2.0).
VALUE LABELS NB_Cat 11 '11 or More'.

GGRAPH
  /GRAPHDATASET NAME="Data" DATASET='RandNB' VARIABLES=NB_Cat[LEVEL=ORDINAL] COUNT()[name="COUNT"] 
  /GRAPHDATASET NAME="PDF" DATASET='PDF_NB' VARIABLES=x pdf
  /GRAPHSPEC SOURCE=INLINE.
BEGIN GPL
  SOURCE: Data=userSource(id("Data"))
  DATA: NB_Cat=col(source(Data), name("NB_Cat"), unit.category())
  DATA: COUNT=col(source(Data), name("COUNT"))
  SOURCE: PDF=userSource(id("PDF"))
  DATA: x=col(source(PDF), name("x"), unit.category())
  DATA: den=col(source(PDF), name("pdf"))
  TRANS: den_per = eval(den*100)
  GUIDE: axis(dim(1))
  GUIDE: axis(dim(2))
  SCALE: linear(dim(2), include(0))
  ELEMENT: interval(position(summary.percent(NB_Cat*COUNT)), shape.interior(shape.square))
  ELEMENT: point(position(x*den_per), color.interior(color.black), size(size."8"))
END GPL.

Negative Binomial regression and predicted probabilities in SPSS

For my dissertation I have been estimating negative binomial regression models predicting the counts of crimes at small places (i.e. street segments and intersections). When evaluating the fit of poisson regression models and their variants, you typically make a line plot of the observed percent of integer values versus the predicted percent by the models. This is particularly pertinent for data that have a high proportion of zeros, as the negative binomial may still under-predict the number of zeros.

I mistakenly thought that to make such a plot you could simply estimate the predicted value following the negative binomial regression model and then round the predictions. But I was incorrect, and to make the typical predicted versus observed plot you need to estimate the probability of an observation taking an integer value, and then take the mean of that probability over all the observations. That mean will subsequently be the predicted percent given the model. Fortunately I caught my mistake before I gave some talks on my work recently, and I will show how to make said calculations in SPSS. I have posted the data to replicate this work at this dropbox link, and so you can download the data and follow along.

First, I got some help on how to estimate the predicted probabilities via an answer to my question at CrossValidated. So that question lists the formula one needs to estimate the predicted probability for any integer value N after the negative binomial model. To calculate that value though we need to make some special SPSS functions, the factorial and the complete gamma function. Both have SPSS tech help pages showing how to calculate them.

For the factorial we can use a general relationship with the LNGAMMA function.


DEFINE !FACT (!POSITIONAL = !ENCLOSE("(",")"))
( EXP(LNGAMMA((!1)+1)) )
!ENDDEFINE.

And for the complete gamma function we can use a relationship to the CDF of the gamma function.


DEFINE !GAMMAF (!POSITIONAL = !ENCLOSE("(",")"))
( EXP(-1)/(!1)/(CDF.GAMMA(1,(!1),1) - CDF.GAMMA(1,(!1)+1,1)) )
!ENDDEFINE.

And given these two functions, we can create a macro that takes as parameters and returns the predicted probability we are interested in:

  • out – new variable name for predicted probability of taking on that integer value
  • PredN – the predicted mean of the variable conditional on the covariates
  • Disp – estimate of the dispersion parameter
  • Int – the integer value being predicted

DEFINE !PredNB (Out = !TOKENS(1)
               /PredN = !TOKENS(1)
                        /Disp = !TOKENS(1)
                        /Int = !TOKENS(1) )
COMPUTE #a = (!Disp)**(-1).
COMPUTE #mu = !PredN.
COMPUTE #Y = !Int.
COMPUTE #1 = (!GAMMAF(#Y + #a))/(!FACT(#Y)*!GAMMAF(#a)).
COMPUTE #2 = (#a/(#a+#mu))**#a.
COMPUTE #3 =  (#mu/(#a + #mu))**#Y.
COMPUTE !Out =  #1*#2*#3.
!ENDDEFINE.

But to make our plot we want to estimate this predicted probability over a range of values, so I created a helper macro that instead of taking only one integer value, takes the end integer value and will calculate the predicted probability of zero through N.


DEFINE !PredNBRange (Num = !TOKENS(1)
                    /Mean = !TOKENS(1)
                    /Disp = !TOKENS(1)
                    /Stub = !TOKENS(1) )
!DO !I = 0 !TO !Num
  !LET !Base = !CONCAT(!Stub,!I)
  !PredNB Out = !Base PredN = !Mean Disp = !Disp Int = !I.
!DOEND 
!ENDDEFINE.

The example data and code I have posted compares these values to the ones predicted from Stata, and shows my function agrees with Stata to about 7 decimal points. I won’t go through all of those commands here, but I will show how to make the predicted proportions plot after you have a vector of predicted probabilities (you can download all of the code and data and the link I reference prior in the post).

So lets say that you have a vector NB0 TO NB8, and these are the predicted probabilities of integer values 0 to 8 for the observations in your dataset. To subsequently get the mean of the predictions, you can use the AGGREGATE command. Having no variables specified on the BREAK subcommand tells SPSS to aggregate over all values in the dataset. Here I export the file to a new dataset named PredNBAgg.


DATASET DECLARE PredNBAgg.
AGGREGATE OUTFILE='PredNBAgg'
  /BREAK = 
  /NB0 TO NB8 = MEAN(NB0 TO NB8).

Now to merge later on to the observed proportions, I will reshape the dataset so the mean values are all in the same column using VARSTOCASES. Here I also make a category for the predicted probability of being 9 or higher (which isn’t typical for these types of plots, but something I believe is useful).


DATASET ACTIVATE PredNBAgg.
COMPUTE NB9_Plus = 1 - SUM(NB0 TO NB8).
VARSTOCASES /MAKE NBPred FROM NB0 TO NB9_Plus /INDEX Int.
COMPUTE Int = Int - 1. /*Index starts at 1 instead of 0 */.

Now I reactivate my original dataset, here named PredNegBin, calculate the binned observed values (with observations 9 and larger recoded to just 9) and then aggregate those values.


DATASET ACTIVATE PredNegBin.
RECODE TotalCrime (9 THRU HIGHEST = 9)(ELSE = COPY) INTO Int.
DATASET DECLARE PredObsAgg.
AGGREGATE OUTFILE='PredObsAgg'
  /BREAK = Int
  /TotalObs = N.

To get the predicted proportions within each category, I need to do another aggregation to get the total number of observations, and then divide the totals of each integer value with the total number of observations.


DATASET ACTIVATE PredObsAgg.
AGGREGATE OUTFILE = * MODE=ADDVARIABLES OVERWRITE=YES
  /BREAK = 
  /TotalN=SUM(TotalObs).
COMPUTE PercObs = TotalObs / TotalN.

Now we can go ahead and merge the two aggregated datasets together. I also go ahead and close the old PredNBAgg dataset and define a value label so I know that the 9 integer category is really 9 and larger.


MATCH FILES FILE = *
  /FILE = 'PredNBAgg'
  /BY Int.
DATASET CLOSE PredNBAgg.
VALUE LABELS Int 9 '9+'.

Now at this point you could make the plot with the predicted and observed proportions in seperate variables, but this would take two ELEMENT statements within a GGRAPH command (and I like to make line plots with both the lines and points, so it would actually take 4 ELEMENT statements). So what I do here is reshape the data one more time with VARSTOCASES, and make a categorical variable to identify if the proportion is the observed value or the predicted value from the model. Then you can make your chart.


VARSTOCASES /MAKE Dens FROM PercObs NBPred /Index Type /DROP TotalObs TotalN.
VALUE LABELS Type 
 1 'Observed'
 2 'Predicted'.
GGRAPH
  /GRAPHDATASET NAME="graphdataset" VARIABLES=Int Dens Type
  /GRAPHSPEC SOURCE=INLINE.
BEGIN GPL
  SOURCE: s=userSource(id("graphdataset"))
  DATA: Int=col(source(s), name("Int"), unit.category())
  DATA: Type=col(source(s), name("Type"), unit.category())
  DATA: Dens=col(source(s), name("Dens"))
  GUIDE: axis(dim(1), label("Total Crimes on Street Units"))
  GUIDE: axis(dim(2), label("Percent of Streets"))
  GUIDE: legend(aesthetic(aesthetic.color.interior), null())
  SCALE: cat(aesthetic(aesthetic.color.interior), map(("1",color.black),("2",color.red)))
  ELEMENT: line(position(Int*Dens), color.interior(Type))
  ELEMENT: point(position(Int*Dens), color.interior(Type), color.exterior(color.white), size(size."7"))
END GPL.

And voila, here you can see the predicted values are so close to the observed that it is difficult to even see the observed values. Here instead of creating a legend I manually added labels to the chart. A better chart may be to subtract the observed from predicted (especially if you were comparing multiple poisson models), but it should be quite plain to see that the negative binomial fits quite well to the observed data in this instance.

Similar to Paul Allison’s experience, even with nearly 64% of the observations being zero, the negative binomial model fits just fine. I recently fit some other models with the same data (but a different outcome) in which the number of zeros were nearer to 90%. In that instance the negative binomial model would not converge, so estimating a zero inflated model was necessary. Here though it is clearly not necessary, and I would prefer the negative binomial model over a zip (or hurdle) as I see no obvious reason why I would prefer the complications of the different predicted zero equation in addition to the count equation.