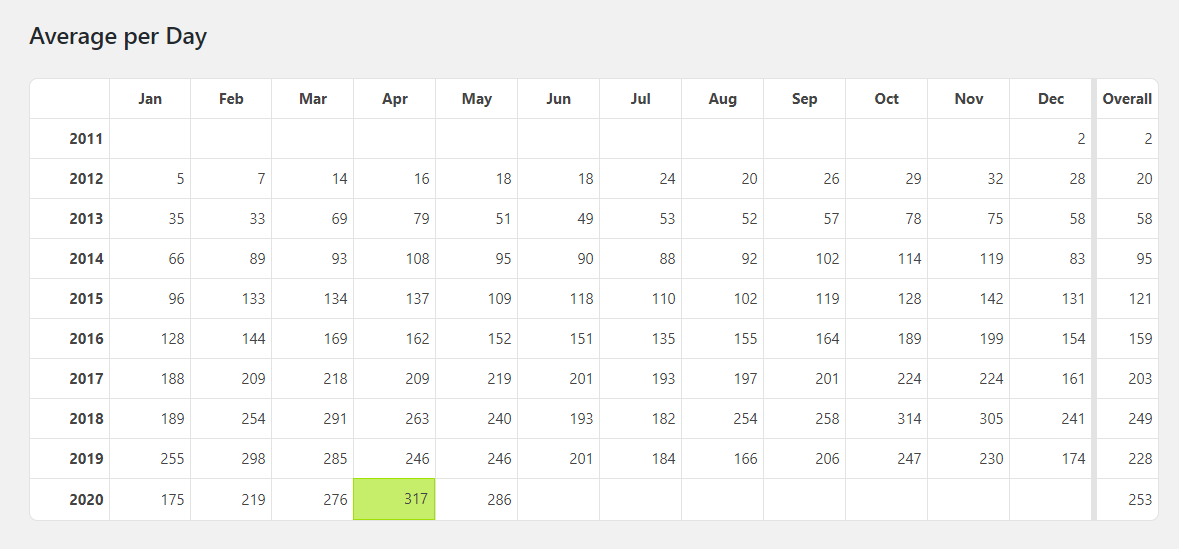
Faking synthetic control estimates

AI disclosure – this post was created via Claude Code using Claude Opus 5 on xhigh reasoning effort. I gave it the idea, the data, the estimator and my prior blog posts as style examples, and it wrote the code and the draft. I will always disclose when I use AI to heavily write any content on this blog. (I use it for minor copy editing all the time.)

A few years back I wrote some notes on the Hogan/Kaplan back and forth. Short version, Tom Hogan used synthetic control to say Larry Krasner’s de-prosecution caused extra homicides in Philadelphia (Hogan, 2022), and Jacob Kaplan, JJ Naddeo and Tom Scott said the result was an artifact of a very short pre-period and a few other specification choices (Kaplan et al., 2026). I thought KNS had the better of the substantive argument. But the thing that has stuck in my head for three years is not the substance, it is that Hogan never released his data or his code. Which meant every attempt at replication ended with no, the data you have are wrong.

Progressive prosecutors are the place in criminology where this bites hardest. It is a live political fight, the effect sizes people claim are enormous, and nearly every candidate jurisdiction has three or four other things going on at the same time. Los Angeles is the poster child. George Gascon was sworn in as LA County DA on December 7th, 2020, but California also had AB 109 realignment in 2011, Prop 47 in 2014 (raising the felony theft threshold to $950), and Prop 57 in 2016. Pick your intervention.

So here is the point of this post. It is not simply that you cannot check someone’s work when they withhold data and code. It is that a researcher who withholds data and code can report whatever post-intervention trajectory they want, and every diagnostic that appears in the paper will look completely normal. The pre-period fit, the table of donor weights, the significance test, the graph. All of it.

I am going to show this with four synthetic control models for monthly thefts in Los Angeles. Three of them are fabricated – one showing no effect, one showing a large increase, one showing a large decrease – and one is honest. Data and code are on github.

To be clear about what I am and am not saying, I have no reason to think Hogan or anybody else in this literature made up numbers. My claim is about what the published record can and cannot rule out. If the only thing standing between a result and fabrication is the author’s say-so, that is not a standard of evidence, it is a character reference.

The setup

For the estimator I use the lasso plus conformal inference approach I have written about before, originally here and then applied to opioid deaths in Oregon and Washington here. You fit a lasso with non-negative coefficients to the treated unit’s pre-period series, using the comparison cities as predictors, and then get prediction intervals out of leave-one-out conformity scores. I like it better than the original Abadie optimizer, and the intervals tend to be tighter than placebo-based tests for state and city level designs.

The data are monthly thefts from the Real-Time Crime Index, which I already had a local snapshot of for another project. I keep agencies with a complete monthly series from January 2017 through November 2024, and use thefts per 100,000. That is 47 pre-period months and 48 post-period months, which is Gascon’s entire term.

For the donor pool I drop San Francisco, Chicago, Philadelphia and New York, since those all have DAs who wore the same label over the same window. I also have to drop the LA County Sheriff’s Department, because Gascon prosecuted its cases too – it is treated, not a control. That leaves 577 comparison agencies.

import FakeSynth
import LassoSynth
import pandas as pd

theft = pd.read_csv('LATheft.csv',parse_dates=['Date'])
wide = LassoSynth.prep_longdata(theft,'Date','Rate','City')

# Jan 2017 - Nov 2020 is the pre-period, so period 47 is Dec 2020
real = LassoSynth.Synth(wide,'Los Angeles, CA',47,alpha=30)
real.fit()
real.weights_table()

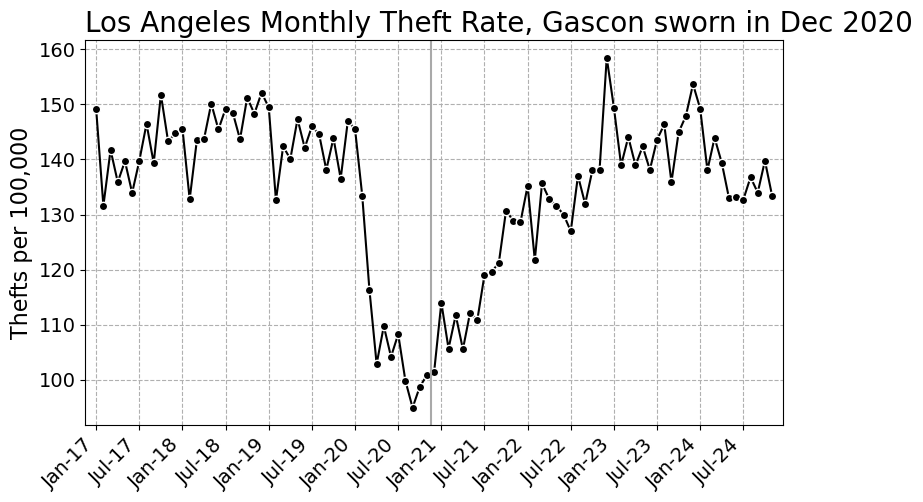
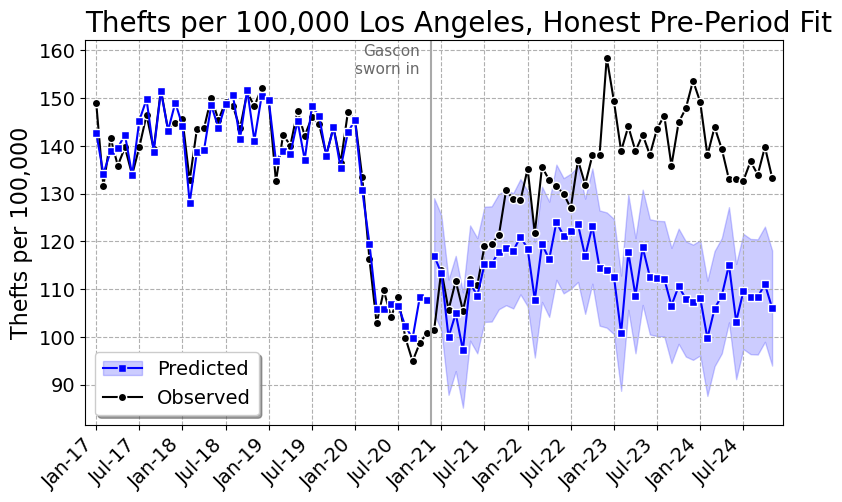
Here is the series we are trying to explain. The pandemic dent is obvious, and Gascon’s swearing in lands almost exactly at the bottom of it, which is its own problem.
The fake

The honest estimator fits the donor weights to the pre-period only. Everything after the vertical line is out of sample. Faking it means fitting the weights to all the periods, where you have replaced the treated unit’s post-period values with whatever you would like to publish. The pre-period values you leave alone, so the pre-period diagnostics stay honest looking.

The substantive change is three lines. Here are the guts of FakeSynth.py:

class FakeSynth(LassoSynth.Synth):
    def __init__(self,data,y,post,fake,alpha=1.0):
        super().__init__(data,y,post,alpha)
        # X is the same, the donor cities are real data
        self.fitX = pd.concat([self.preX,self.postX],axis=0)
        # y is real pre-period, whatever you want post-period
        fs = pd.Series(np.asarray(fake),index=self.postY.index,name=y)
        self.fitY = pd.concat([self.preY,fs],axis=0)
    def fit(self):
        # only difference, fit on all the periods
        self.mapie.estimator.fit(self.fitX,self.fitY)
        self.mapie.fit(self.fitX,self.fitY)
        # pre-period diagnostics versus the real pre-period data
        y_pred = self.mapie.predict(self.preX,ensemble=False)
        ...

And writing down the three stories takes one line each. For no effect, the synthetic Los Angeles should land on top of the observed data. For an increase, it should sit below. For a decrease, above.

obs_post = wide['Los Angeles, CA'].iloc[47:].to_numpy()

fakes = {'Fake null': obs_post*1.00,
         'Fake increase': obs_post*0.80,   # synthetic 20% under observed
         'Fake decrease': obs_post*1.25}   # synthetic 25% over observed

No effect

fake = FakeSynth.FakeSynth(wide,'Los Angeles, CA',47,obs_post*1.00,alpha=30)
fake.fit()
# {'RMSE': 4.85, 'RSquare': 0.913}
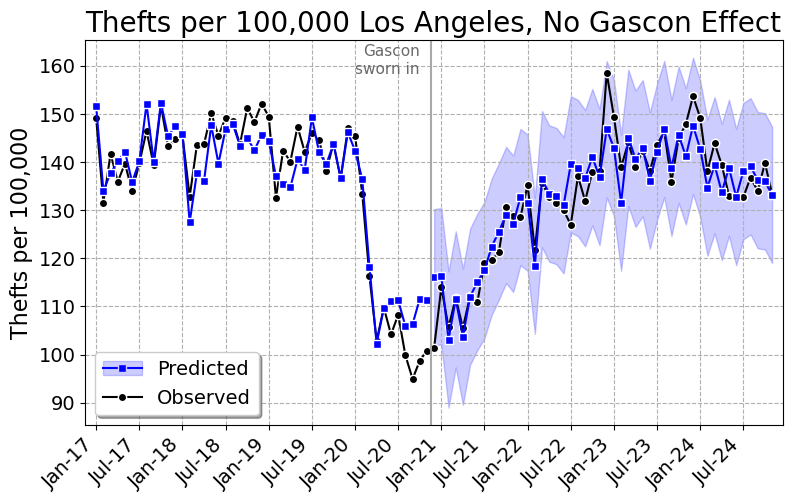
Pre-period R-square of 0.91, and the synthetic tracks LA right through the post period. Cumulative effect of 3 thefts per 100,000 over four years, 95% interval of -88 to 87. Gascon did nothing. Here are the ten largest weights, out of 27 that are non-zero:

City Weight
Intercept 37.1923
Alpharetta, GA 0.0780
Hayward, CA 0.0672
Miami, FL 0.0629
Baltimore, MD 0.0531
Vacaville, CA 0.0439
Paterson, NJ 0.0439
Wayne Township, NJ 0.0397
Baldwin Park, CA 0.0350
Detroit, MI 0.0328
Porterville, CA 0.0237

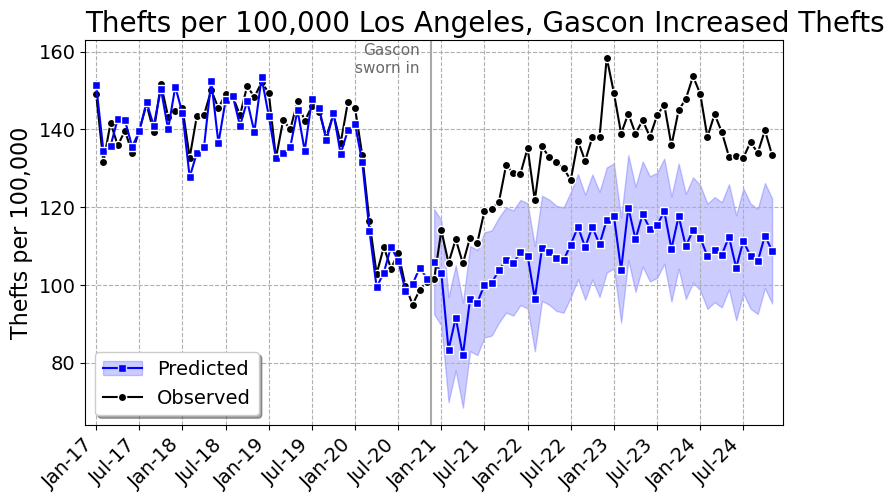
Gascon increased thefts

Pre-period R-square of 0.92, and the gap opens up right at December 2020 and never closes. That is +23.2%, a cumulative 1,199 thefts per 100,000, which given LA’s population is about 46,000 extra thefts over Gascon’s term. The 95% interval is 1,091 to 1,313. If you wanted a number for a press release, there it is.

City Weight
Intercept 6.6812
Laredo, TX 0.1313
Vacaville, CA 0.0542
Hayward, CA 0.0541
Novato, CA 0.0449
Antioch, CA 0.0432
Baltimore, MD 0.0369
Aiken Cnty, SC 0.0364
McAllen, TX 0.0362
Harlingen, TX 0.0360
Baldwin Park, CA 0.0337

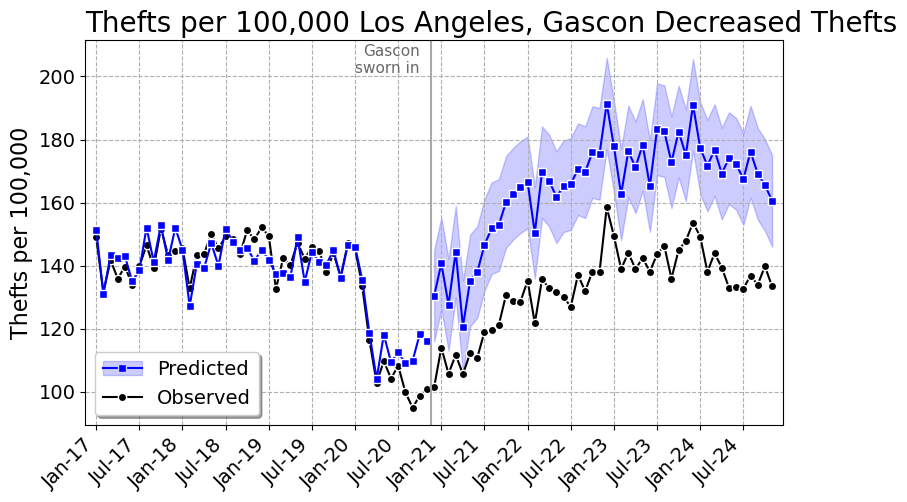
Gascon decreased thefts

Same data, same code, same pre-period. -19.5%, or 59,662 thefts prevented, with a 95% interval that comfortably excludes zero. Pre-period R-square of 0.87. Gascon the crime fighter.

City Weight
Intercept 19.0633
Vallejo, CA 0.1618
Gardena, CA 0.0962
Arcadia, CA 0.0891
Paterson, NJ 0.0882
Alpharetta, GA 0.0625
Miami, FL 0.0467
Hayward, CA 0.0418
Baltimore, MD 0.0391
Frisco, TX 0.0380
Folsom, CA 0.0340

All four at once

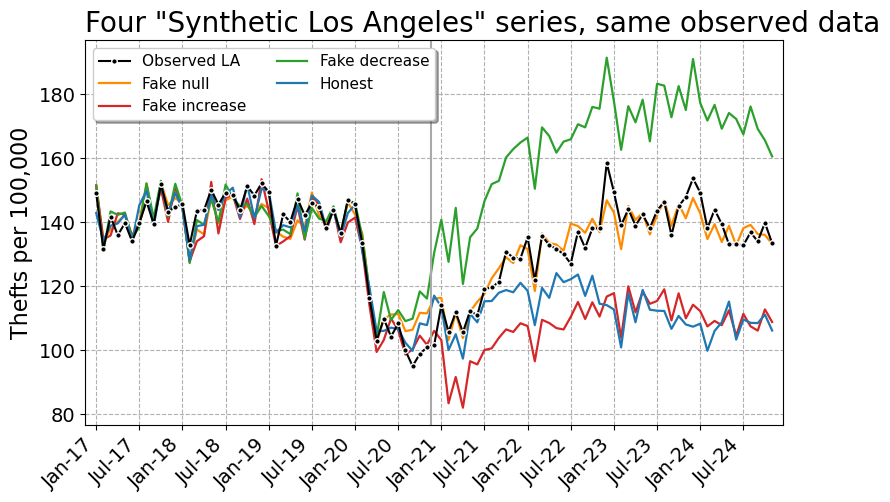
Here is what the fabrication looks like when you put the three fakes and the honest model on one set of axes. Identical observed data, identical donor pool, identical software. Four “synthetic Los Angeles” series that sit on top of each other in the pre-period and are 54 per 100,000 apart in the final month.
And the cumulative effect graphs, which is what actually ends up in the paper:
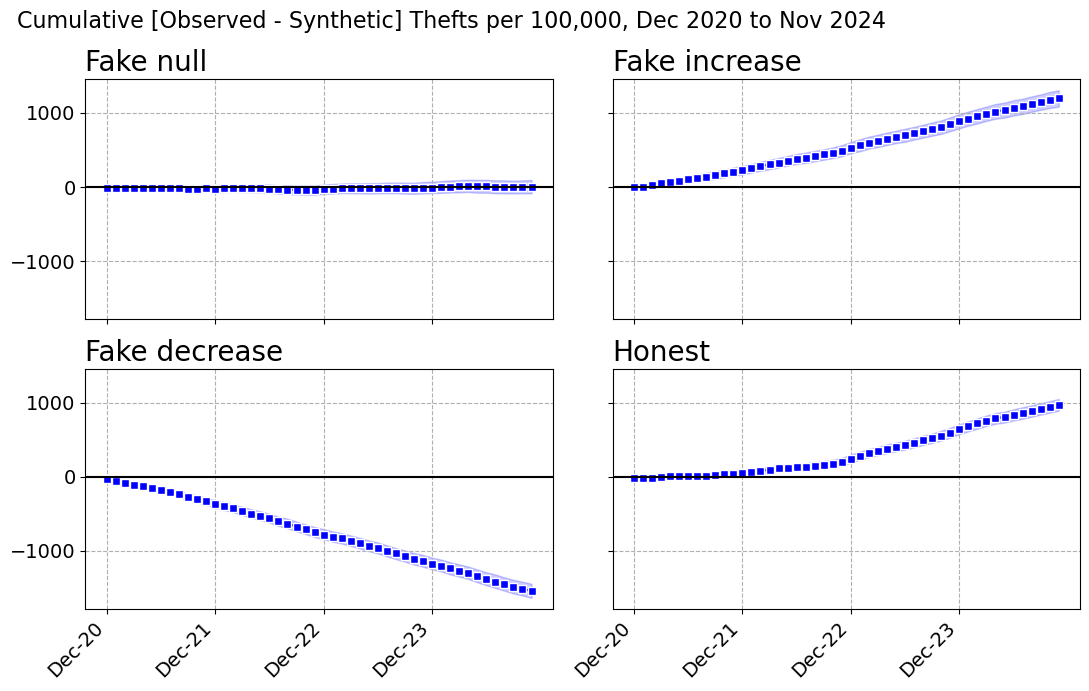
Model Pre RMSE Pre R2 Donors Monthly per 100k Percent Cumulative per 100k 95% CI Total Thefts
Fake null 4.85 0.913 27 0.1 0.0% 3 -88 to 87 108
Fake increase 4.55 0.924 31 25.0 23.2% 1,199 1,091 to 1,313 46,470
Fake decrease 5.88 0.872 22 -32.1 -19.5% -1,540 -1,640 to -1,442 -59,662
Honest 3.52 0.954 16 20.2 18.0% 972 900 to 1,041 37,644

There is exactly one number in that table that separates the fakes from the honest model, and it is the pre-period fit. The honest model does a little better, R-square 0.954 versus 0.872 to 0.924. That is because the fabricated model has to fit the real pre-period and the made up post-period simultaneously, so at a fixed penalty it gives up a bit of pre-period accuracy.

Which is not a tell you can use, for two reasons. First, nobody reading the paper knows what pre-period fit was achievable. Second, the fabricator can just turn the penalty down:

alpha Honest RMSE Honest R2 Faked RMSE Faked R2 Faked Percent
1 0.55 0.999 2.71 0.973 24.5%
5 1.57 0.991 3.27 0.961 24.2%
10 2.09 0.984 3.76 0.948 23.9%
20 2.92 0.969 4.22 0.934 23.5%
30 3.52 0.954 4.55 0.924 23.2%

At alpha=1 the fabricated model has a pre-period R-square of 0.973 – better than the honest model at the penalty I actually used – and still reports a 24.5% increase. You cannot referee your way out of this.

It is also worth killing the obvious partial remedy. “Fine, don’t release the microdata, just publish your weights.” That does not help at all. I took the published fake weights, multiplied them by the public donor data, and recovered the reported synthetic series to 13 decimal places. A replicator checking the weights against the donor data will confirm the figure exactly. The only thing that would catch this is re-estimating the weights from the pre-period, and that needs the donor pool, the data vintage, the tuning parameter and the software version – every one of which is something the original author can dispute after the fact. Which is precisely the Hogan situation.

The real answer

Now the honest model, weights fit on January 2017 through November 2020 only, everything after that out of sample.
City Weight
Intercept 22.2752
Laredo, TX 0.0965
Tucson, AZ 0.0928
Concord, CA 0.0782
Fairfield, CA 0.0726
Rock Hill, SC 0.0327
Baltimore, MD 0.0249
Portsmouth, VA 0.0238
Bakersfield, CA 0.0217
Santa Clara, CA 0.0179
Schaumburg, IL 0.0177

LA thefts run about 18% above the synthetic estimate, a cumulative 972 per 100,000 or roughly 37,600 extra thefts. So the honest answer in my preferred specification is in the same direction, and about three quarters the size, as the increase I made up.

I do not believe that number, and neither should you. Look at the graph, and at the gap by year:

Year Observed Synthetic Difference
2020 (Dec) 101.5 117.0 -15.5
2021 117.3 111.8 5.5
2022 134.8 118.5 16.3
2023 143.7 110.7 33.0
2024 137.6 107.7 29.9

That is a gap that starts negative, crosses zero sometime in 2021, and then grows for two straight years. It is not what a policy change that happened in December 2020 looks like. It is what a slow divergence in trend looks like, and a synthetic control cannot tell those apart. And here is what the estimate does when you poke it:

Spec Donors Percent Cumulative per 100k Total Thefts
Rates, all donors, alpha=5 38 15.0% 832 32,237
Rates, all donors, alpha=10 29 16.7% 912 35,321
Rates, all donors, alpha=20 22 18.1% 975 37,784
Rates, all donors, alpha=30 16 18.0% 972 37,644
Rates, all donors, alpha=50 12 15.8% 870 33,709
Rates, all donors, alpha=80 11 12.6% 710 27,524
Rates, 250k+ donors, alpha=10 13 9.7% 561 21,731
Rates, 250k+ donors, alpha=30 9 11.2% 643 24,911
Counts, all donors, alpha=30 43 5.3% n/a 12,381
Placebo Dec 2018 (12 mo), alpha=30 9 -3.9% -69 -2,690

The penalty barely matters, 13% to 18% across a sixteen-fold range of alpha. Two other things matter a lot. Restricting the donor pool to cities over 250,000 – on the grounds that Rock Hill, South Carolina is not a plausible counterfactual for Los Angeles – cuts it to about 10%. And doing it in counts instead of rates, which is the exact thing Hogan and KNS fought over, cuts it to 5.3%.

The last row is the one that should really bother you. Pretend Gascon took office in December 2018, throw away everything after November 2019, and refit. You get a statistically significant 4% decrease in thefts, over a year in which Jackie Lacey was DA and nothing in particular happened. If the design can find a four percent effect where there is nothing to find, an 18% estimate over a window containing a pandemic, an LAPD that shed more than a thousand officers, and a change in LAPD’s records system is not measuring a district attorney.

So my honest answer is: somewhere between 5% and 18%, with a failed placebo, and I would not put it in a paper. Which is the unsatisfying part. The fabricated numbers in this post are cleaner, tighter and more publishable than the real one. That is the incentive problem, and it is why “trust me, I’d rather not share the data” cannot be an acceptable answer.

Nerd Notes

The prediction intervals in the fabricated models come from conformity scores computed over all 95 periods, including the invented ones. So they are conditional on the fabrication and a bit narrower than they should be. If you cared about not leaving that particular fingerprint, you would compute the conformity scores from the pre-period only, which is another two lines.

I used a flat proportional shift because it is the simplest thing to explain. A more careful fabricator would use a phase-in – say a ramp over the first twelve months and then flat – because instantaneous discontinuities at the treatment date look suspicious to a reader who has seen a lot of these graphs. The lasso fits that just as happily. You can make the counterfactual any shape you like, including one where the effect conveniently only shows up in year three.

Nothing here is specific to synthetic control. Any method where the counterfactual is a fitted object – interrupted time series, matching, DiD with unit specific trends, an ML forecast – can be run backwards from the answer you want. Synthetic control is just an unusually comfortable place to do it, because it is a pure curve-fitting exercise with a large number of free parameters and a professional convention of reporting pre-period fit as the main validity check. Here I have 577 donors and 47 pre-period months. Drop the penalty to essentially zero and the pre-period R-square is 0.9999998, which should tell you how much that fit statistic is really worth.

There is a spillover issue I left in on purpose. Gascon prosecuted cases for every police department in LA County, so Long Beach, Pasadena, Pomona, Torrance and about thirty others in the donor pool are treated units. If Gascon actually moved thefts, leaving them in biases the estimate toward zero. I dropped the Sheriff’s Department – it polices about 945,000 residents of the county and shares the name in the data – but left the rest, and the code has a note about it. Same for Boston, Baltimore, St. Louis and Austin, all of which have a decent claim to the progressive prosecutor label over this window. Note that Baltimore City shows up in all four weights tables above.

The RTCI data are monthly counts as reported, and reporting practices are not stable. LAPD cut over to a new records management system starting March 7th, 2024, phased across bureaus through May, to comply with the FBI’s NIBRS-only mandate. LAPD’s own announcement warned the new format “may give the impression of increased crime levels.” That is inside my post period. To its credit, it does not look like it is driving anything here – the gap was already 33 per 100,000 through 2023 and it shrinks slightly in 2024 – but it is the kind of thing that a synthetic control on other cities cannot fix and that I would not have known about if I had not gone looking.

The repo has the full weights tables and the month by month effects for all four models as CSVs, not just the top ten I printed here. PrepGasconData.py builds the analysis file from the RTCI snapshot, FakeSynth.py is the fabrication, and GasconAnalysis.py makes every table and figure in this post. You will need mapie on top of the usual scientific python stack.

Finally, a defense that would actually work: preregister the donor pool and the estimator, then post the data and code. Both. If you will not post the code, you have not published a result, you have published an assertion with graphs.

References

Deep research and open access

Most of the major LLM chatbot vendors are now offering a tool called deep research. These tools basically just scour the web given a question, and return a report. For academics conducting literature reviews, the parallel is obvious. We just tend to limit the review to peer reviewed research.

I started with testing out Google’s Gemini service. Using that, I noticed almost all of the sources cited were public materials. So I did a little test with a few prompts across the different tools. Below are some examples of those:

  • Google Gemini question on measuring stress in police officers (PDF, I cannot share this chat link it appears)
  • OpenAI Effectiveness of Gunshot detection (PDF, link to chat)
  • Perplexity convenience sample (PDF, Perplexity was one conversation)
  • Perplexity survey measures attitudes towards police (PDF, see chat link above)

The report on officer mental health measures was an area I was wholly unfamiliar. The other tests are areas where I am quite familiar, so I could evaluate how well I thought each tool did. OpenAI’s tool is the most irksome to work with, citations work out of the box for Google and Perplexity, but not with ChatGPT. I had to ask it to reformat things several times. Claude’s tool has no test here, as to use its deep research tool you need a paid account.

Offhand each of the tools did a passable job of reviewing the literature and writing reasonable summaries. I could nitpick things in both the Perplexity and the ChatGPT results, but overall they are good tools I would recommend people become familiar with. ChatGPT was more concise and more on-point. Perplexity got the right answer for the convenience sample question (use post-stratification), but also pulled in a large literature on propensity score matching (which is only relevant for X causes Y type questions, not overall distribution of Y). Again this is nit-picking for less than 5 minutes of work.

Overall these will not magically take over writing your literature review, but are useful (the same way that doing simpler searches in google scholar is useful). The issue with hallucinating citations is mostly solved (see the exception for ChatGPT here). You should consult the original sources and treat deep research reports like on-demand Wikipedia pages, but lets not kid ourselves – most people will not be that thorough.

For the Gemini report on officer mental health, I went through quickly and broke down the 77 citations across the publication type or whether the sources were in HTML or PDF. (Likely some errors here, I went by the text for the most part.) For the HTML vs PDF, 59 out of 77 (76%) are HTML web-sources. Here is the breakdown for my ad-hoc categories for types of publications:

  • Peer Review (open) – 39 (50%)
  • Peer review (just abstract) 10 (13% – these are all ResearchGate)
  • Open Reports 23 (30%)
  • Web pages 5 (6%)

For a quick rundown of these. Peer reviewed should be obvious, but sometimes the different tools cite papers that are not open access. In these cases, they are just using the abstract to madlib how Deep Research fills in its report. (I consider ResearchGate articles here as just abstract, they are a mix of really available, but you need to click a link to get to the PDF in those cases. Google is not indexing those PDFs behind a wall, but the abstract.) Open reports I reserve for think tank or other government groups. Web pages I reserve for blogs or private sector white papers.

I’d note as well that even though it does cite many peer review here, many of these are quite low quality (stuff in MDPI, or other what look to me pay to publish locations). Basically none of the citations are in major criminology journals! As I am not as familiar with this area this may be reasonable though, I don’t know if this material is often in different policing journals or Criminal Justice and Behavior and just not being picked up at all, or if that lit in those places just does not exist. I have a feeling it is missing a few of the traditional crim journal sources though (and picks up a few sources in different languages).

The OpenAI report largely hallucinated references in the final report it built (something that Gemini and Perplexity currently do not do). The references it made up were often portmanteaus of different papers. Of the 12 references it provided, 3 were supposedly peer reviewed articles. You can in the ChatGPT chat go and see the actual web-sources it used (actual links, not hallucinated). Of the 32 web links, here is the breakdown:

  • Pubmed 9
  • The Trace 5
  • Kansas City local news station website 4
  • Eric Piza’s wordpress website 3
  • Govtech website 3
  • NIJ 2

There are single links then to two different journals, and one to the Police Chief magazine. I’d note Eric’s site is not that old (first RSS feed started in February 2023), so Eric making a website where he simple shares his peer reviewed work greatly increased his exposure. His webpage in ChatGPT is more influential than NIJ and peer reviewed CJ journals combined.

I did not do the work to go through the Perplexity citations. But in large part they appear to me quite similar to Gemini on their face. They do cite pure PDF documents more often than I expected, but still we are talking about 24% in the Gemini example are PDFs.

The long story short advice here is that you should post your preprints or postprints publicly, preferably in HTML format. For criminologists, you should do this currently on CrimRXiv. In addition to this, just make a free webpage and post overviews of your work.

These tests were just simple prompts as well. I bet you could steer the tool to give better sources with some additional prompting, like “look at this specific journal”. (Design idea if anyone from Perplexity is listening, allow someone to be able to whitelist sources to specific domains.)


Other random pro-tip for using Gemini chats. They do not print well, and if they have quite a bit of markdown and/or mathematics, they do not convert to a google document very well. What I did in those circumstances was to do a bit of javascript hacking. So go into your dev console (in Chrome right click on the page and select “Inspect”, then in the new page that opens up go to the “Console” tab). And depending on the chat browser currently opened, can try entering this javascript:

// Example printing out Google Gemini Chat
var res = document.getElementsByTagName("extended-response-panel")[0];
var report = res.getElementsByTagName("message-content")[0];
var body = document.getElementsByTagName("body")[0];
let escapeHTMLPolicy = trustedTypes.createPolicy("escapeHTML", {
 createHTML: (string) => string
});
body.innerHTML = escapeHTMLPolicy.createHTML(report.innerHTML);
// Now you can go back to page, cannot scroll but
// Ctrl+P prints out nicely

Or this works for me when revisiting the page:

var report = document.getElementById("extended-response-message-content");
var body = document.getElementsByTagName("body")[0];
let escapeHTMLPolicy = trustedTypes.createPolicy("escapeHTML", {
 createHTML: (string) => string
});
body.innerHTML = escapeHTMLPolicy.createHTML(report.innerHTML);

This page scrolling does not work, but Ctrl + P to print the page does.

The idea behind this, I want to just get the report content, which ends up being hidden away in a mess of div tags, promoted out to the body of the page. This will likely break in the near future as well, but you just need to figure out the correct way to get the report content.

Here is an example of using Gemini’s Deep Research to help me make a practice study guide for my sons calculus course as an example.

How much do students pay for textbooks at GSU?

Given I am a big proponent of open data, replicable scientific results, and open access publishing, I struck up a friendship with Scott Jacques at Georgia State University. One of the projects we pursued was a pretty simple, but could potentially save students a ton of money. If you have checked out your universities online library system recently, you may have noticed they have digital books (mostly from academic presses) that you can just read. No limits like the local library, they are just available to all students.

So the idea Scott had was identify books students are paying for, and then see if the library can negotiate with the publisher to have it for all students. This shifts the cost from the student to the university, but the licensing fees for the books are not that large (think less than $1000). This can save money especially if it is a class with many students, so say a $30 book with 100 students, that is $3000 students are ponying up in toto.

To do this we would need course enrollments and the books they are having students buy. Of course, this is data that does exist, but I knew going in that it was just not going to happen that someone just nicely gave us a spreadsheet of data. So I set about to scrape the data, you can see that work on Github if you care too.

The github repo in the data folder has fall 2024 and spring 2025 Excel spreadsheets if you want to see the data. I also have a filterable dashboard on my crime de-coder site.

You can filter for specific colleges, look up individual books, etc. (This is a preliminary dashboard that has a few kinks, if you get too sick of the filtering acting wonky I would suggest just downloading the Excel spreadsheets.)

One of the aspects though of doing this analysis, the types of academic publishers me and Scott set out to identify are pretty small fish. The largest happen to be Academic textbook publishers (like Pearson and McGraw Hill). The biggest, coming in at over $300,000 students spend on in a year is a Pearson text on Algebra.

You may wonder why so many students are buying an algebra book. It is assigned across the Pre-calculus courses. GSU is a predominantly low income serving institution, with the majority of students on Pell grants. Those students at least will get their textbooks reimbursed via the Pell grants (at least before the grant money runs out).

Being a former professor, these course bundles in my area (criminal justice) were comically poor quality. I accede the math ones could be higher quality, I have not purchased this one specifically, but this offers two solutions. One, Universities should directly contract with Pearson to buy licensing for the materials at a discount. The bookstore prices are often slightly higher than just buying from other sources (Pearson or Amazon) directly. (Students on Pell Grants need to buy from the bookstore though to be reimbursed.)

A second option is simply to pay someone to create open access materials to swap out. Universities often have an option for taking a sabbatical to write a text book. I am pretty sure GSU could throw 30k at an adjunct and they would write just as high (if not higher) quality material. For basic material like that, the current LLM tools could help speed the process by quite a bit.

For these types of textbooks, professors use them because they are convenient, so if a lower cost option were available that met the same needs, I am pretty sure you could convince the math department to have those materials as the standard. If we go to page two of the dashboard though, we see some new types of books pop up:

You may wonder, what is Conley Smith Publishing? It happens to be an idiosyncratic self publishing platform. Look, I have a self published book as well, but having 800 business students a semester buy your self published $100 using excel book, that is just a racket. And it is a racket that when I give that example to friends almost everyone has experienced in their college career.

There is no solution to the latter professors ripping off their students. It is not illegal as far as I’m aware. I am just guessing at the margins, that business prof is maybe making $30k bonus a semester forcing their students to buy their textbook. Unlike the academic textbook scenario, this individual will not swap out with materials, even if the alternative materials are higher quality.

To solve the issue will take senior administration in universities caring that professors are gouging their (mostly low income) students and put a stop to it.

This is not a unique problem to GSU, this is a problem at all universities. Universities could aim to make low/no-cost, and use that as advertisement. This should be particularly effective advertisement for low income serving universities.

If you are interested in a similar analysis for your own university, feel free to get in touch with either myself or Scott. We would like to expand our cost saving projects beyond GSU.

Getting access to paywalled newspaper and journal articles

So recently several individuals have asked about obtaining articles they do not have access to that I cite in my blog posts. (Here or on the American Society of Evidence Based Policing.) This is perfectly fine, but I want to share a few tricks I have learned on accessing paywalled newspaper articles and journal articles over the years.

I currently only pay for a physical Sunday newspaper for the Raleigh News & Observer (and get the online content for free because of that). Besides that I have never paid for a newspaper article or a journal article.

Newspaper paywalls

Two techniques for dealing with newspaper paywalls. 1) Some newspapers you get a free number of articles per month. To skirt this, you can open up the article in a private/incognito window on your preferred browser (or open up the article in another browser entirely, e.g. you use Chrome most of the time, but have Firefox just for this on occasion.)

If that does not work, and you have the exact address, you can check the WayBack machine. For example, here is a search for a WaPo article I linked to in last post. This works for very recent articles, so if you can stand being a few days behind, it is often listed on the WayBack machine.

Journal paywalls

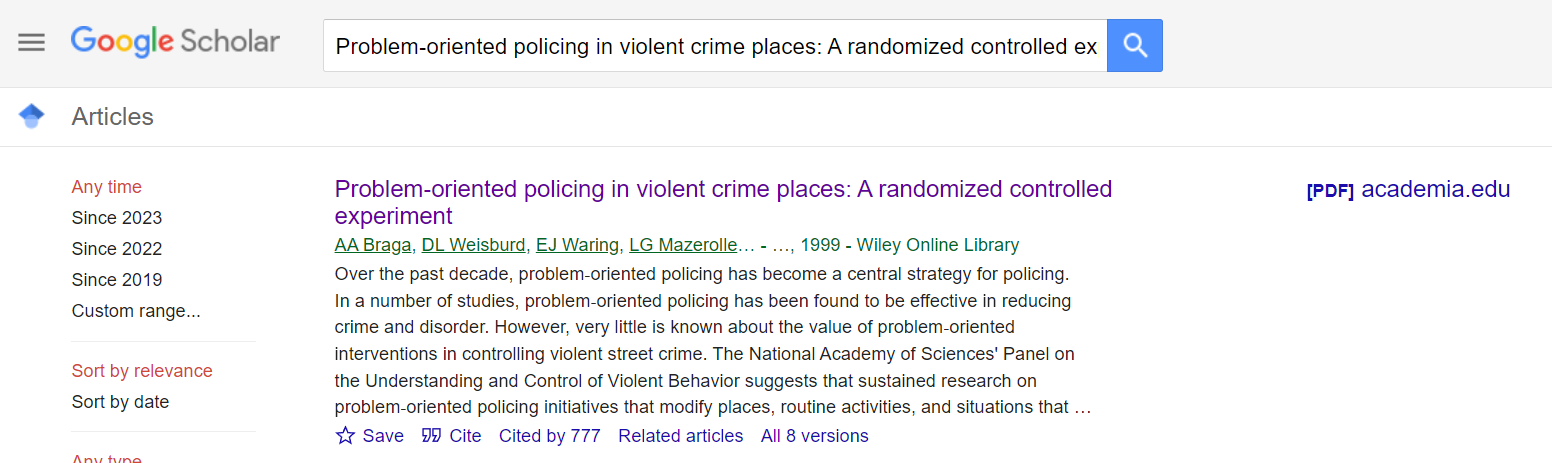
Single piece of advice here, use Google Scholar. Here for example is searching for the first Braga POP Criminology article in the last post. Google scholar will tell you if a free pre or post-print URL exists somewhere. See the PDF link on the right here. (You can click around to “All 8 Versions” below the article as well, and that will sometimes lead to other open links as well.)

Quite a few papers have PDFs available, and don’t worry if it is a pre-print, they rarely substance when going into print.1

For my personal papers, I have a google spreadsheet that lists all of the pre-print URLs (as well as the replication materials for those publications).

If those do not work, you can see if your local library has access to the journal, but that is not as likely. And I still have a Uni affiliation that I can use for this (the library and getting some software cheap are the main benefits!). But if you are at that point and need access to a paper I cite, feel free to email and ask for a copy (it is not that much work).

Most academics are happy to know you want to read their work, and so it is nice to be asked to forward a copy of their paper. So feel free to email other academics as well to ask for copies (and slip in a note for them to post their post-prints to let more people have access).

The Criminal Justician and ASEBP

If you like my blog topics, please consider joining the American Society of Evidence Based Policing. To be clear I do not get paid for referrals, I just think it is a worthwhile organization doing good work. I have started a blog series (that you need a membership for to read), and post once a month. The current articles I have written are:

So if you want to read more of my work on criminal justice topics, please join the ASEBP. And it is of course a good networking resource and training center you should be interested in as well.


  1. You can also sign up for email alerts on Google Scholar for papers if you find yourself reading a particular author quite often.↩︎

Managing R environments using conda

DataColada have a recent blog about their groundhog package, intended to aid in reproducible science. This is more from a perspective of “I have this historical code, how can I try to replicate that researchers environment to get the same results”. So more of a forensic task. What I am going to talk about in this post is to create an environment from the get-go that has the info necessary for others to replicate.

First before I get to that though, I have come across people critiquing open science using essentially ‘the perfect is the enemy of the good’ arguments. Sharing code is good, period. Even if there are different standards of replicability, some code is quite a bit better than no code. And scientists are not professional programmers – understanding all of this stuff takes time and training often in short supply in academia (hence me blogging about boring stuff like creating environments and using github). If this stuff is over your head, please feel free to email/ask a question and I can try to help.

At work I have to solve a very similar problem to scientific reproducibility; I need to write code in one environment (a dev environment, or sometimes my laptop), and then have that code run in a production environment. The way we do this at work is either via conda environments (for persistent environments) or docker images (for ephemeral environments). We currently are 100% python for machine learning, but you can also use the same workflow for R environments (or have a mashup of R/python).

Groundhog doesn’t really solve this all by itself – it doesn’t specify the version of R for example. (And there are issues with even using dates to try to forensically recreate environments, see the Hackernews thread.) But you can use conda directly to set up a reproducible environment from the get-go. Again, what is good for reproducible science is good for reproducing my work in different environments at my workplace.

I have a github folder to show the steps, but just here they are quite simple. First to start, in your project directory at the root, have two files. One is a requirements.txt file that specifies the R libraries you want. And this file may look like:

# This is the requirements.txt file
r-spatstat
r-leaflet
r-devtools
r-markdown

Conda has an annoying add r-* at the front to distinguish r packages from python ones. If there happen to be libraries you are using that are not on conda-forge (e.g. just added to CRAN, or more likely just are on github), we can solve that as well. Make a second script, here I name it packs.R, and within this R script you can install these additional packages. Here is an example installing groundhog, and my ptools package that is only on github. Each have ways you can point to a very specific version:

# This is the packs.R script
library(devtools) # for installing github packages

# Install specific commit/version from github
install_github("apwheele/ptools",ref="9826241c93e9975804430cb3d838329b86f27fd3")

# Install a specific library version from CRAN
# Specifying specific version url for cran package (not on conda-forge)
gh_url <- "https://cran.r-project.org/src/contrib/groundhog_1.5.0.tar.gz"
install.packages(gh_url,repos=NULL,type="source")

OK, so now we are ready to set up our conda environment, so from the command line (or more specifically the anaconda prompt), if you are in the root of your project, you can run something like:

conda create --name rnew
conda activate rnew
conda install -c conda-forge r-base=4.0.5 --file requirements.txt

And this installs a specific version of R, as well as those libraries in the text file. Then if you have additional libraries in the packs.R to install, you can then run:

Rscript packs.R

And conda is smart and the library defaults to installing all the R junk in the right folder (can print out .libPaths() in an R session to see where your conda environment lives). (I am more familiar with conda, so cannot comment, but likely this is exchangeable with RStudio’s renv, horses for courses.)

You may notice my requirements.txt file does not have specific versions. Often you want to be generic when you are first setting up your project, and let conda figure out the mess of version dependencies. If you want to be uber vigilant then, you can then save the exact versions of packages via overwriting your initial requirements file, something like:

conda list --export > requirements.txt

And this updated file will have everything in it, R version, conda-forge ID, etc. (although does not have the packages you installed not via conda, so still need to keep the packs.R file to be able to replicate).

I will put on the slate an example of using docker to create a totally independent environment to replicate code on. I think that is a bit over-kill for most academic projects (although is really even more isolated than this work flow). Even all this work is not 100% foolproof. conda or CRAN or the github package you installed could go away tomorrow – no guarantees in life. But again don’t let the perfect be the enemy of the good – share your scientific code, warts and all!

Bias and Transparency

Erik Loomis over at the LGM blog writes:

It’s fascinating to be doing completely unfundable research in the modern university. It means you don’t matter to administration. At all. You are completely irrelevant. You add no value. This means almost all humanities people and a good number of social scientists, though by no means all. Because universities want those corporate dollars, you are encouraged to do whatever corporations want. Bring in that money. But why would we trust any research funded by corporate dollars? The profit motive makes the research inherently questionable. Like with the racism inherent in science and technology, all researchers bring their life experiences into their research. There is no “pure” research because there are no pure people. The questions we ask are influenced by our pasts and the world in which we grew up. The questions we ask are also influenced by the needs of the funder. And if the researcher goes ahead with findings that the funder doesn’t like, they are severely disciplined. That can be not winning the grants that keep you relevant at the university. Or if you actually work for the corporation, being fired.

And even when I was an unfunded researcher at university collaborating with police departments this mostly still applied. The part about the research being quashed was not an issue for me personally, but the types of questions asked are certainly influenced. A PD is unlikely to say ‘hey, lets examine some unintended consequences of my arrest policy’ – they are much more likely to say ‘hey, can you give me an argument to hire a few more guys?’. I do know of instances of others people work being limited from dissemination – the ones I am familiar with honestly it was stupid for the agencies to not let the researchers go ahead with the work, but I digress.

So we are all biased in some ways – we might as well admit it. What to do? One of my favorite passages in relation to our inherent bias is from Denis Wood’s introduction to his dissertation (see some more backstory via John Krygier). But here are some snippets from Wood’s introduction:

There is much rodomontade in the social sciences about being objective. Such talk is especially pretentious from the mouths of those whose minds have never been sullied by even the merest passing consideration of what it is that objectivity is supposed to be. There are those who believe it to consist in using the third person, in leaning heavily on the passive voice, in referring to people by numbers or letters, in reserving one’s opinion, in avoiding evaluative adjectives or adverbs, ad nauseum. These of course are so many red herrings.

So we cannot be objective, no point denying it. But a few paragraphs later from Wood:

Yet this is no opportunity for erecting the scientific tombstone. Not quite yet. There is a pragmatic, possible, human out: Bare yourself.

Admit your attitudes, beliefs, politics, morals, opinions, enthusiasms, loves, odiums, ethics, religion, class, nationality, parentage, income, address, friends, lovers, philosophies, language, education. Unburden yourself of your secrets. Admit your sins. Let the reader decide if he would buy a used car from you, much less believe your science. Of course, since you will never become completely self-aware, no more in the subjective case than in the objective, you cannot tell your reader all. He doesn’t need it all. He needs enough. He will know.

This dissertation makes no pretense at being objective, whatever that ever was. I tell you as much as I can. I tell you as many of my beliefs as you could want to know. This is my Introduction. I tell you about this project in value-loaded terms. You will not need to ferret these out. They will hit you over the head and sock you in the stomach. Such terms, such opinions run throughout the dissertation. Then I tell you the story of this project, sort of as if you were in my – and not somebody else’s – mind. This is Part II of the dissertation. You may believe me if you wish. You may doubt every word. But I’m not conning you. Aside from the value-loaded vocabulary – when I think I’ve done something wonderful, or stupid, I don’t mind giving myself a pat on the back, or a kick in the pants. Parts I and II are what sloppy users of the English language might call “objective.” I don’t know about that. They’re conscientious, honest, rigorous, fair, ethical, responsible – to the extent, of course, that I am these things, no farther.

I think I’m pretty terrific. I tell you so. But you’ll make up your mind about me anyway. But I’m not hiding from you in the the third person passive voice – as though my science materialized out of thin air and marvelous intentions. I did these things. You know me, I’m

Denis Wood

We will never be able to scrub ourselves clean to be entirely objective – a pure researcher as Loomis puts its. But we can be transparent about the work we do, and let readers decide for themselves whether the work we bring forth is sufficient to overcome those biases or not.

Open source code projects in criminology

TLDR; please let me know about open source code related criminology projects.

As part of my work with CrimRxiv, we have started the idea of creating a page to link to various open source criminology focused projects. That is overly broad, but high level here we are thinking for pragmatic resources (e.g. code repositories/packages, open source text books), as opposed to more traditional literature.

As part of our overlay journal we are starting, D1G1TAL & C0MPUTAT10NAL CR1M1N0L0GY, we are trying to get folks to submit open source work for a paper. (As a note, this will not have any charges to publish.) The motivation is two-fold: 1) this gives a venue to get your code peer reviewed (e.g. similar to the Journal of Open Source Software). This is mainly for the writer, to give academic recognition for your open source work. 2) Is for the consumer of the information, it is a nice place to keep up on current developments. If you write an R package to do some cool analysis I want to be aware of it!

For 2, we can accomplish something similar by just linking to current projects. I have started a spreadsheet of links I am collating for now, (in the future will update to this page, you need to be signed into CrimRxiv to see that list). For examples of the work I have collated so far:

Then we have various R packages from folks floating around; Greg Ridgeway, Jerry Ratcliffe, Wouter Steenbeek (as well as the others I mentioned previously you can check out their other projects on Github). Please add in info into the google spreadsheet, comment here, or send me an email if you would like some work you have done (or know others have done) that should be added.

Again I want to know about your work!

Reproducible research and code review for journals

Recently came across two different groups broaching the subject of code reviews and reproducible research more broadly for criminal justice. There are certainly aspects of either that make it difficult in the context of peer review. But I am not one to let the perfect be the enemy of the good, so I will layout the difficulties and give some comments on potential good enough solutions that still make marked improvements on the current state of affairs in crim/cj research.

Reproducible Research

So what do I mean by reproducible research? Jeromy Anglim on crossvalidated has a good breakdown on different ways we may apply the term. So to some it may mean if you did a hot spots policing experiment, can I replicate the same crime reduction results in another city.

These are important to publish (simply because social science experiments will inevitably have quite a bit of variance), but this is often not what we are talking about when we talk about replication. We are often talking about a much smaller in scope goal – if I give you the exact same data, can you reproduce the tables/figures in the manuscript you used to make your inferences?

One problem that is often the case with CJ research is that we are working with sensitive data. If I do analysis on a survey of a sensitive topic, I often cannot share the data. But, I do not believe that should entirely put a spike in the question of reproducible data. I have broken down different levels that are possible in making research more reproducible:

  1. A Sharing data and code files to reproduce the paper results
  2. B Sharing code files and simulated data that illustrate the results
  3. C Sharing the plain-text log files showing the code and results of tables/figures

So I have not seen C proposed anywhere, but it is a dead simple solution that almost everyone should be able to accommodate. It simply involves typing log using "output.txt", text at the top of your Stata file, or OUTPUT EXPORT /PDF DOCUMENTFILE="output.pdf" at the end of your SPSS analysis (or could be done via the GUI), etc. These are the log/output files used to generate the results you report in the paper, and typically contain both the commands run, as well as the resulting tables. These files can quite easily not contain privileged information (in fact they won’t be default most of the time, unless you printed out individual names in a table for example in intermediate results).

To accomplish C does take some modicum of wherewithal in terms of writing code, but it is a pretty low bar. So I see no reason why all quantitative analyses cannot require at least this step right now. I realize it is not foolproof – a bad actor could go and edit the results (same as they could edit the results without this information). But it ups the level of effort to manipulate results by quite a bit, and more importantly has the potential to catch more mundane transcription errors that occur quite frequently.

Sometimes I want more details on the code used, the nature of the data etc. (Most quasi-experimental design for example can be summed up as shape your data in a special way and run a particular regression model.) For people like me who care about that, B helps with that, in that I can see the code front-to-back, can actually go and inspect the shape and values in a particular rectangular dataset, and see how the code interacts with those objects. The only full on example of this I am aware of is a recent example paper in Nature Behavior that shares the code using simulated data.

B is also very similar to people who release statistical packages to reproduce their code. So if you release an R package that conducts your new fancy technique, even if you can’t share your data it is really good for people to be able to view the underlying code even by itself to understand the technique better and in conjunction build on your work more. If you do a new technique, it is a crazy ton of work to replicate that on your own, so most people will not bother.

A is most of the way there to the gold standard – if you can share both the data and the code used to reproduce the analysis. Both A and B take a significant amount of knowledge of statistical programming to accomplish. Most people in our field do not have the skills to write an analysis front-to-back that can run in a series of scripts though. To get to A/B grad programs in crim/cj need to spend crazy more time on teaching these skills, which is near zero now almost across the board.

One brief thing to mention about A is that the boundary is difficult to define. So for example, I share code to reproduce analysis in my 311 and crime at micro places in DC paper (paper link, code). But this starts from a dataset that has the street units in DC and all of the covariates already compiled. But where did that dataset come from? I created it by compiling many different sources, so the base dataset is itself very difficult to replicate. Again not letting the perfect be the enemy of the good, I think just starting from your compiled dataset, and replicating the tables/graphs in the manuscript is better than letting the fuzzy boundary prevent you from sharing anything.

Code Reviews for Journal Submissions

The hardest part of A is that even after you share your data, some journals want to be able to run the code locally to entirely reproduce your results. So while I have shared data code (A above) for many papers, see this spreadsheet, they have not been externally vetted by any of those journals. This vetting is the standard in some economic journals now I believe, and would not be surprised in some poli-sci journals as well. This is a very hard problem though, and requires significant resources from both the journal and the researcher to be able to do that.

The biggest hurdle is that even if you share your data/code, your particular system may be idiosyncratic. You may have different R libraries installed than me. You may have different versions of python packages. I may have used a program on Windows to do some analysis you cannot do on a Mac. You may rely on some paid API I cannot access.

These are often solvable problems, but take quite a bit of time to work out. A comparable example to my work is when data scientists say ‘going to production’. This often involves taking some analysis I did on my local machine, and making it run autonomously on my companies servers. There are some things that make it more or less difficult than the typical academic situation, but I think it is broadly comparable. To go to production for a project will typically take me 3-6 months at 50% of my time, so maybe something like 300 hours for a lowish end estimate. And that is just the time it takes from the researchers end, from the journals end it will also take a significant amount of time to compile every ones code and verify the results.

Because of this, I don’t think the fully reproducible re-run my code and generate the exact same tables are feasible in the current way we do academic research and peer review. But again that is why I list C above – we shouldn’t let the perfect be the enemy of the good.

Validating New Empirical Techniques

The code review above is not really code review in the sense that someone looks at your code and says this is correct, it is simply just saying can I get the same results as you. You may want peer review to accomplish the task of not only saying is it reproducible, but is it valid/correct? There are a few things towards this end I would like to see more often in crim/cj. I realize we are not statistics, so cannot often ask for formal proofs. But there are simpler things we can do to verify the results. These are the responsibility of the researcher to provide, not the reviewer to script up on their own to validate someone elses work.

One, illustrate the technique using a very simplified example. So for instance, in my p-median patrol areas paper, I show an example of constructing the linear program with only four areas. You should be able to calculate what the result should be by hand, so can verify the correctness of your algorithm. This has the added benefit of being a very good pedagogical way to describe your method.

Two, illustrate the technique on a larger sample of simulated data in which you again know the correct result. For one example of this, I showed how to estimate group based trajectory models using deep learning libraries. Again your model/method should be able to recover the correct result (which you know) given the simulated fake data.

Three, validate the result using real data compared to the current standard. For crime mapping papers, this means comparing forecasts compared to RTM, or simpler regression models, or simply prior crime = future crime on out of sample data. Amazingly many machine learning papers in CJ do not do out of sample predictions. If it is an inferential procedure, comparing the results to some other status quo technique is similar, such as showing conformal prediction intervals have smaller widths (so more statistical power) than placebo results for synthetic control designs (at least for that example with state panel level crime data).

You may not have all three of these examples in any particular paper, but I think for very new techniques 1 or 2 is necessary. 3 is often a by-product on the analysis anyway. So I do not believe any of these asks are that onerous. If you have the skills to create some new technique, you should be able to accomplish 1 or 2.

I do not have any special advice in terms of the reviewers perspective. When I do code reviews at work, what we do is go line by line, and my co-workers give high level design advice. E.g. you should use a config file for this instead of defining it inline, you should turn this block into a function, you should make a class to open/close the database connections etc. The code reviews do not validate the technical correctness, so if I queried the wrong data they wouldn’t know in the code review. The proof is in the pudding so to speak, so if my results are performing really badly in the real world I know I am doing something wrong. (And the obverse, if my results are on the mark and making money I am pretty sure I did nothing terribly wrong.)

Because there are not these real world mechanisms to validate code in peer reviewed papers, my suggestions for 1/2/3 are the closest I think we can get in many circumstances. That and simply making your code available will dramatically improve the reproducibility and validity of your research compared to the current status quo in our field.

A bunch of random shout outs

Busy, busy, busy! Hopefully I will have some time in the near future to write up some more data science posts. But for now, here is a small python snippet to help you build interaction variables between two sets of numpy arrays/dataframes.

import numpy as np
def np_int(a,b):
    rows = a.shape[0]
    cols = a.shape[1]*b.shape[1]
    return np.einsum('ij,ik->ijk', a, b).reshape((rows,cols))

This works for pytorch as well (just replace np.einsum with torch.einsum). So coming up (eventually) I will illustrate encoding interaction between hidden layers in a deep learning model. But for now some quicker updates.

Shout out #1: Scott Jacques has continued to push the charge for open access to criminology journals. He has two recent posts about post-prints, and how our main journal (Criminology) has an excessive policy of not allowing authors to post post prints for over two years (whereas the majority of criminology journals allow you to post immediately).

Several aspects of open science are tricky – posting pre-prints/post-prints is not. If we can come together as a group this is an easy, no cost way to greatly improve the accessibility of our work to the greater public.

Shout out #2: The folks at Police Rewired have hosted a hackathon intended to Hack Hate. It is too late to participate, but they will be displaying the results this Sunday. I have not had the chance to participate in any code hackathons, I will need to make a concerted effort in the future to give at least one a shot. (It seems hard, how can you do any work in only a day or a week or two!? But the proof is in the pudding so to speak, I’ve have seen some pretty cool things come out of various hackathons in the past.)

Shout out #3: My workplace, HMS, is involved in a data sharing collaborative called the Digital Health DRC. They also have a hackathon coming up, but this is related to Telehealth use. The Digital Health DRC is pretty cool though, it is basically a way for HMS (and several other private sector entities) to share various datasets with researchers over the globe.

The scope of HMS’s data is somewhat outside the realm of my old stomping grounds of criminology (but not entirely, a big part of my job is identifying potentially fraudulent patterns in claims data). But for folks who have a research question that could be answered using health insurance claims data, this is a good resource to look into. (HMS has pretty good coverage of Medicare claims across the US.)

Finally, I experimented a few days on the site with hosting ads. I managed to serve up a few thousand and make 10 cents. So I will turn that off for now. I debated on putting the button for folks to donate a coffee, but even that is not necessary. (I can afford the few bucks for the domain, and I use dropbox to back up my files anyway, so hosting extra materials is not a big deal.) I rather folks just take my nerdy notes and make your own cool stuff (and share them with me!) I may need to figure out a better hosting solution for images though — google photos is continuing to give me troubles I see (so if you see an image is not coming through feel free to let me know in the comments or send me an email).

300 blog posts and public good criminology

This isn’t technically my 300th blog post, but the 300th page I’ve constructed on my blog (so e.g. it includes when I’ve made a page for a class). I’ve posted a spreadsheet of the titles and dates of the posts over time (and updating it I noticed I was at 300).

I typically get around 200~300 views per day. Most of these are probably bots, but unless say over 90% are bots this website gets way more views than the cumulative views of all my academic papers combined. Here is a screen shot of the stats wordpress gives to me. My downtick in 2019 I thought was going to spiral into very few views, but it is still holding on.

I kind of have three different types of blog posts. One are example code snippets/data analysis. Often these are things I have done multiple times, so I want to create a record for me to more easily search up later. For example making a hexbin map in ggplot, or a margins plot in Stata. I wrote a recent post because I was talking with a friend about crime weights, and I wanted an example of using regression in python and an error bar plot for my library. (Quite a few birds with that stone.)

Two are questions I repeatedly encounter by students. For example, I made a list of demographic variables I use in the census, and where to find or scrape crime generator variables. Consistently my most popular post is testing the equality of two regression coefficients.

The third are just more generic opinion pieces. For example my notes on (the now late) David Bayley’s writing on the police potential to reduce crime, or Jane Jacob’s take on neighborhoods, or that I don’t think latent trajectories are real things.

Some are multiple of these categories put together, particularly opinion pieces with example code snippets to illustrate the points I am making. Like a simulation of why I like to model individual delinquency items, or how to balance false positives in bail decisions.

On Public Good Criminology

None of these per se fit in the example framework of typical peer review output. So despite no peer review, I think things like deriving optimal treatment allocation with network spillovers, or that conformal predictions intervals for synthetic control estimates are much smaller than permutation tests are a substantive contribution to share!

So that brings me to the public good point. Most criminologists have a default of only valuing a closed peer review system. Despite my blog posts not being peer reviewed (ditto for the pre-prints I post at first), I hope folks can take the time to judge for themselves whether they are valuable or not. We would be much better off as a group if we did things like share code, share class preps, or failed projects by default.

Some of these posts I might write up if we had a short journal for our field akin to Economics Letters, but even that is a lot of work for very little value added to be frank. (If I had infinite time I also might turn my notes on Poisson/Negative Binomial regression into a little Sage green book.) Being a private sector data scientist now without the tenure boot on my neck, I don’t really have any need or desire to go through that process.

If all you value are getting the opinions of a handful of other academics than by all means keep your work close to the chest and only publish in peer reviewed journals. If you want to provide a public good though, your work actually needs to be public.