
I recently published my peer review of Andresen, Curman, and Linning (2016), The Trajectories of Crime at Places: Understanding the Patterns of Disaggregated Crime Types. In it I probably come off as a bit curmudgeonly, but in my defense I voted for revise-and-resubmit (I don’t know why Publons does not have a field to note this in your review).
I’ve gotten a few questions about doing trajectory analysis, so I figured I would come out and make my opinion pretty clear — I don’t think such trajectories exist. Part of the motivation in my paper to estimate the trajectories in Albany was to replicate Weisburd’s work in Seattle. (Andresen et al. (2016) give the same reasoning for their currently cited article — at least to stick with the k-means clustering procedure anyway.) But that does not mean I think distinct groups of trajectories exist. I tried to sneak this in wherever possible in my JQC article, but if you just quickly skimmed it you might not have that impression.
For an ugly image I generated but did not make the paper, here is my reasoning that discrete trajectories do not exist:
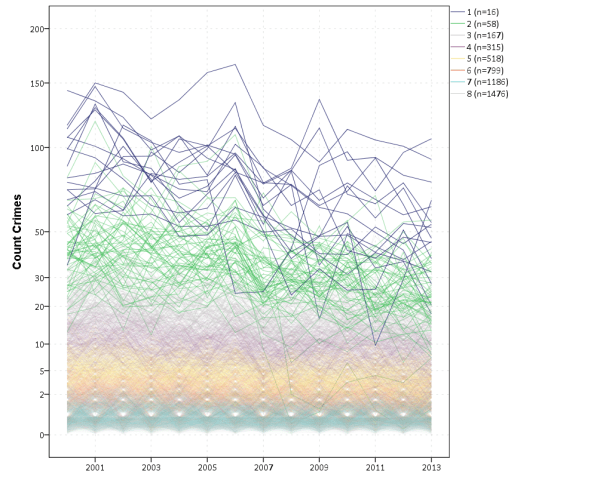
You can see that each individual grouping (unique colors) basically overlaps with each other. This solution passes all the usual model based criteria for trajectory groups, and each individual line tends to have a very high posterior probability of assignment to its respective group. Despite this there is essentially no separation between the groups – they all just blend into one another. If people plotted the individual trajectories this would be more obvious in other work, but people almost always solely plot the predicted trajectories.
Now, although I’m pretty sure that the clusters are not real (at least in the data I have seen) that does not mean that I don’t think they can be useful. Longitudinal data can be complicated, and clustering trajectories are a simple procedure to make sense of it. For a good example of its utility, Weisburd et al., (2015) used it to assign blocks for a randomized experiment. This is a slightly more robust way than ranking based some prior time interval (in that it might out some weird trajectory groups that simple averaging would not).
I believe it is similar in utility to creating hot spot polygons or maps of kernel density estimates. They can illuminate the patterns the messy data, but the hot spot the computer spits out is not a real entity – it is something we arbitrarily created.


2 Comments