
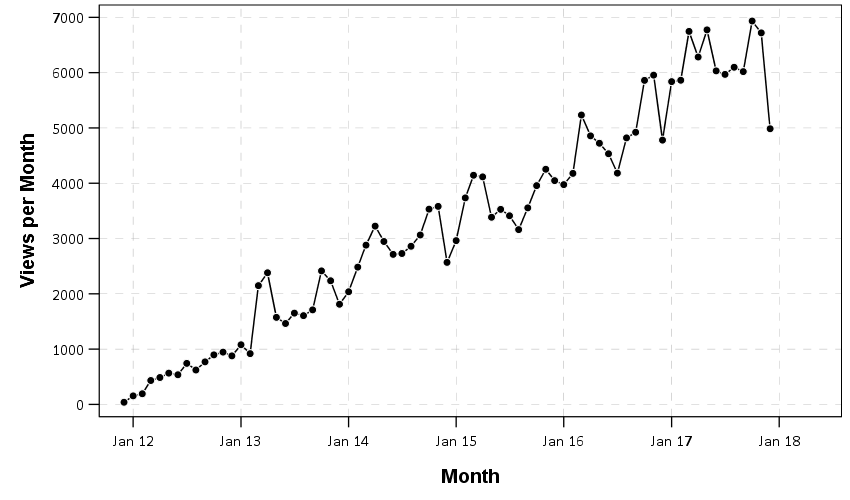
So the blog has continued to show linear growth in terms of views over time, I take a good hit though in December.
I only ended up writing 35 new posts in 2017 (that includes things that are not blog posts, like pages I created for new classes). For comparison in 2015 I wrote 50, and 2016 I wrote 40. I’ve managed to be pretty consistent though over time, here is the cumulative total over time.
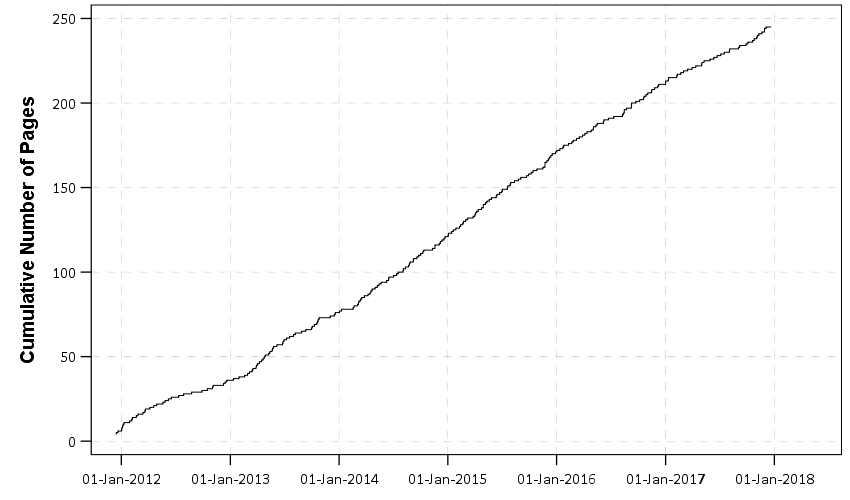
That is more or less what I aim for, to just have some content every few weeks.
There is not much to say in terms of popular posts on the site for the year. My most popular posts are ones I’ve written in previous years. I did not have any post this year gain a large number of viewers when it was first written. It is just a slow accumulation of around 200 views per day, mostly people being referred via Google searches.
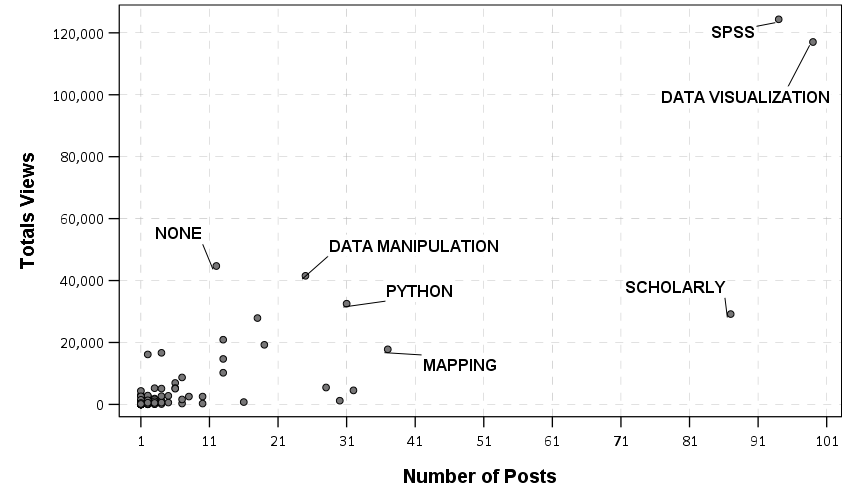
I wanted to analyze the topics I’ve written about over time, so I grabbed all of the tags I’ve placed on posts. I collapsed both categories and tags, as I don’t really make much of a distinction when I pick them. Here is a graph of the number of posts that have that tag and the page views (this will double count page views, for example a post could have both SPSS and Data Visualization). None refers to pages that are not blog posts, like my home page and pages I created for class syllabi.
If we look at the ratio though, you can see my scholarly posts are mostly ignored, only in total do they accumulate much viewing.
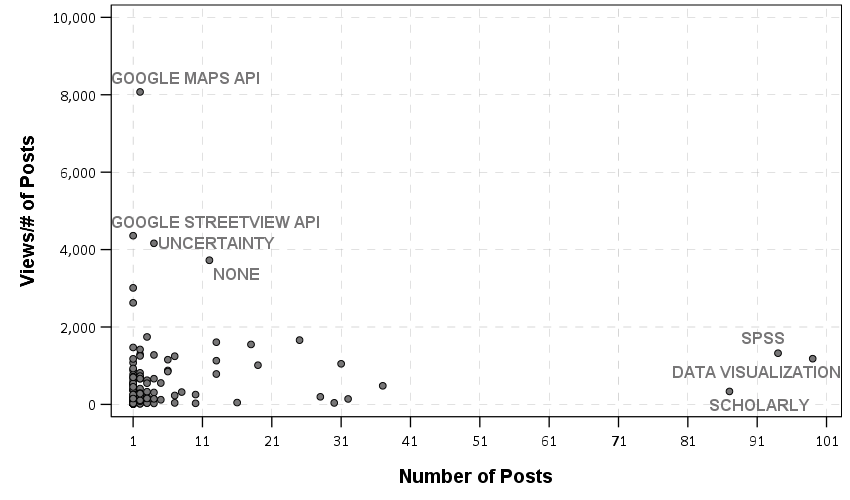
My posts on showing how to use various google maps services with python must be reasonably high in Google searches, as I get a slow trickle of hits for them every day. The high uncertainty is driven by my ratios need to be plotted on log scales post.
I tried to analyze whether the content of my posts substantively has changed over time. I suspected since I took my job at Dallas my posts swayed more towards paper/scholarly (the tag I use for academic related things) and more away from technical computing stuff. I have too few of posts though (and too many tags) to easily make sense of it. Taking only tags that are included on 30 or more posts, here are the counts of those tags over time.
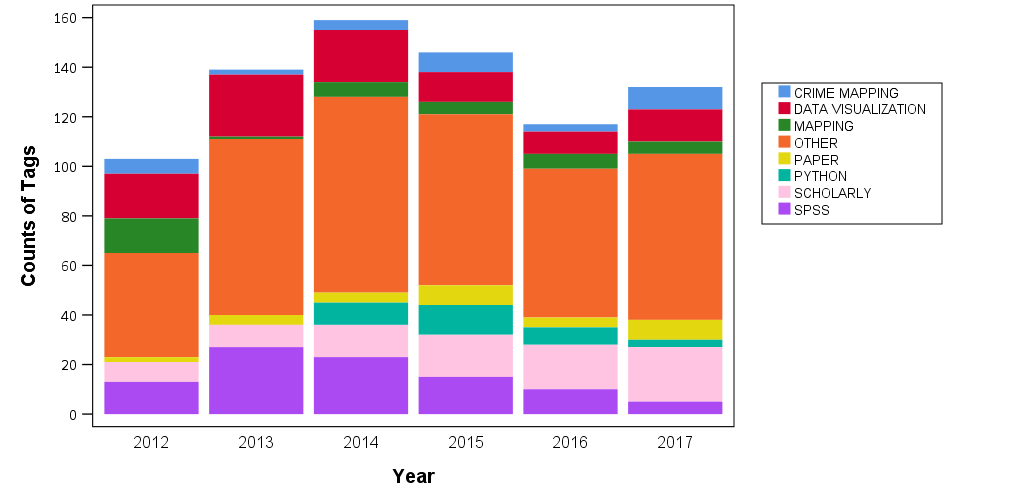
About the only clear trend is that scholarly has risen with SPSS dropping, the other frequent categories though look to me to be fairly consistent. I could spend more time grouping the tags into thematic content, but I have too many other things I need to do (including writing other blog posts)!
Happy New Year!


Jeff Boggs
/ January 15, 2018I just wanted to thank you for maintaining this website. I’ve found it quite useful as I make sense of GPL in SPSS. As a geographer, I’ve also found your ArcGIS related posts interesting.
Do you still use SPSS? Or has it been entirely replaced (at least for your new projects) by R or Stata? Or do you find it is still superior to other packages for some techniques?
apwheele
/ January 15, 2018Thank you Jeff. I still use SPSS quite often, especially for data management stuff, as I am more familiar with it than Stata or R. They are largely exchangeable for the majority of uses though. I often have projects that have code in two to three different languages at this point (e.g. some Python and SPSS, or some R and Stata, etc.)
I still use ArcGIS often for static maps (had a few ideas for posts about ArcGIS – just need more time!)
I’m not real dogmatic about it, I choose whatever I think I can get the job done the fastest in (and make the nicest looking graphs/maps!)