
For tasks that take a long time, or ones I want done on a regular basis, I typically have the computer do the work while I am away. Such example tasks I have set up before are:
- querying large databases and dumping the results into flat files (querying large tables may take an hour or longer)
- conducting statistical analysis that takes a long time to converge
- generating automated graphs and statistics
The SPSS facility to accomplish these are production jobs, and I will briefly detail how to set up a production job and then run the job from the command line with a simple example.
So first to set up a production job go to Utilities -> Production Facility in the menu bar. (Note you can open the screen shots larger in a separate window.)

Next you will be presented with the screen below. To specify the syntax file(s) that the production job will run, click the New button.
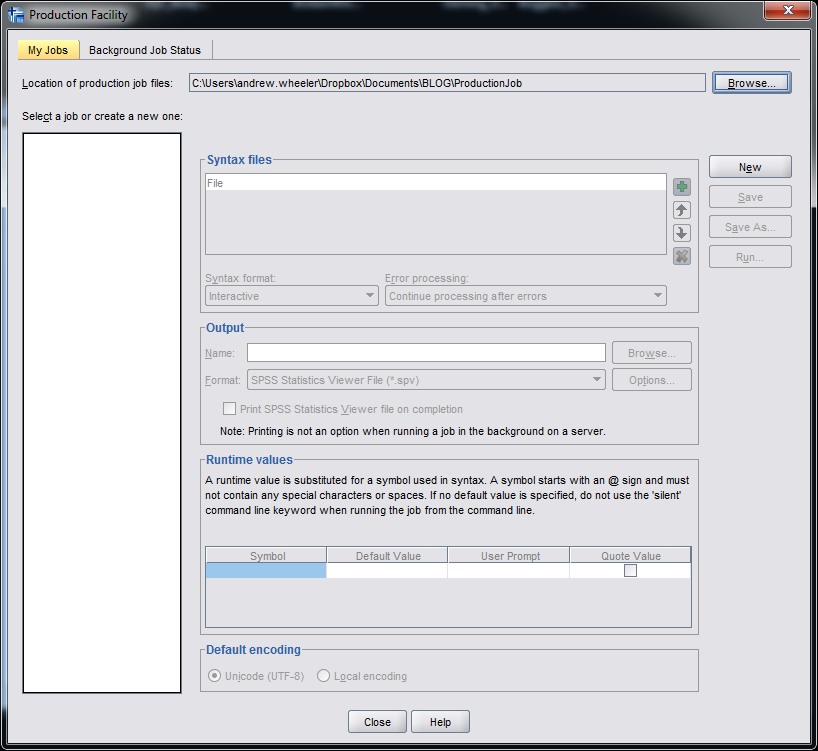
After you click the New button, the green plus sign in the Syntax files section will be active, and then you can browse to your sps file. Here you can see I selected a file named GenerateChart.sps in a particular directory on my C drive. You can specify the job to run multiple syntax files, but here I only choose one.

Next navigate to the Output section of the window. Here you need to choose where to save the SPSS output. Here I choose to save it in the same directory under the name Output. I choose the output format to be plain text. This ends up being the same output as if you ran the syntax interactively and then used EXPORT OUTPUT.

I could have exported the charts in the syntax directly by using EXPORT OUTPUT, but you can have the production facility do that as well. If you click on the Options button in the Output section a new dialogue will appear that lets you choose to save the charts if you want. Here I save them as png files.

Production jobs also have the capability to create user input variables directly in the syntax, using the form @VariableName in the syntax. This is what the section Run time variables deals with. These are nice if you have a set of syntax and want to input some arbitrary information, as when you run the production job a GUI pops up asking for the input, but I don’t illustrate that functionality here.
Below is the specific set of syntax that grabs a csv file, swdata.csv, calculates a moving median for each chat room, and makes some time series charts. The csv file is a set of scrapped chat data from the Cross Validated and R chat rooms via Scraperwiki (more details here). It aggregates the number of monologue tags (a pretty good indicator of the number of posts in the room) per day, so is an estimate of the chat activity.
*Where the data is located.
FILE HANDLE data
  /NAME = "C:\Users\andrew.wheeler\Dropbox\Documents\BLOG\ProductionJob".
DATA LIST LIST (",") FILE = "data\swdata.csv" SKIP = 1
  /Date (SDATE10) Mono (F4.0) Baseroom (A100).
DATASET NAME Chats.

*Calculate moving median.
AUTORECODE VARIABLES = Baseroom /INTO BaseN.
SORT CASES BY BaseN Date.
SPLIT FILE BY BaseN.
CREATE MovMed = RMED(Mono 5).
FORMATS MovMed (F4.0) Date (MOYR6).

*Make charts.
GGRAPH
  /GRAPHDATASET NAME="graphdataset" VARIABLES=Date Mono MovMed
   MISSING=VARIABLEWISE
  /GRAPHSPEC SOURCE=INLINE.
BEGIN GPL
  SOURCE: s=userSource(id("graphdataset"))
  DATA: Date=col(source(s), name("Date"))
  DATA: Mono=col(source(s), name("Mono"))
  DATA: MovMed=col(source(s), name("MovMed"))
  GUIDE: axis(dim(1))
  GUIDE: axis(dim(2), label("Mono Tags"))
  ELEMENT: line(position(Date*Mono), color(color.grey),
           transparency(transparency."0.5"), size(size."1"))
  ELEMENT: line(position(Date*MovMed), color(color.red),
           transparency(transparency."0.4"), size(size."1"))
END GPL.
Now I am interested in running this set of syntax automatically. The details will change depending on your operating system, but on my windows machine the easiest way to do this is to create a bat file that specifies the commands. Now I named the production job ChatRoom_Dialogue.spj, and to run this job I filled in the bat file with the text:
REM delete old csv file and download new one
del swdata.csv
wget "http://goo.gl/mxyRI7" --no-check-certificate
REM this runs the SPSS syntax
"C:\Program Files\IBM\SPSS\Statistics\22\stats.exe"  "C:\Users\andrew.wheeler\Dropbox\Documents\BLOG\ProductionJob\ChatRoom_Dialogue.spj" -production silent
Here I downloaded the wget utility to grab the csv file. (Note REM is to comment lines.) The bat file treats where ever it is located at as the directory for the commands, so I first use del to delete the older csv file, and then grab the new csv file from the listed url and it automatically saves the file in the folder where the bat file is located. Then I call the SPSS syntax by starting stats.exe and then calling the spj production job file. I use the switches -production silent so I am not prompted for any user input values to insert into the syntax. If you had stats.exe as a windows system path you wouldn’t need to worry about using the fully quoted strings, but I typically don’t rely on that (unless the program automatically adds it). Note that running the fully quoted string for stats.exe makes the windows command directory go to there, so you need to then fully quote the spj files path. Note you could call the first two commands directly within SPSS using the HOST command, but being able to chain multiple commands together makes running them in the bat file directly a bit more flexible.
So now you can simply double click the bat file and it will download the new data and create two graphs. To automate the job you can use the Windows task scheduler to make the bat file run at a particular time. Here is the bundled up files to run on your own (you just need to change the files paths in the sps and the bat file to wherever you want to run the script).
Here are the two graphs the production job creates. The first is the Cross Validated chat room, and the second is the R stackoverflow chat room.


I planned on writing a blog post for the CV blog awhile ago about these trends, so if I ever get to it these are teasers.


Jon Peck
/ December 3, 2014Two comments:
1) The @ symbol substitution uses the standard Statistics macro facility, so if you want, for example, substitution in a literal such as a title, you need to write the syntax in such a way that that will be expanded.
2) If you have Statistics Server available, the production facility can run the job on that remote server so you can free up your local machine. In that scenario, you need to write the syntax so that file references are with respect to the server file system.
apwheele
/ December 3, 2014Yes good things to know Jon. Also that you can do the @ substitution from the command line – although I have not come across a situation in which I needed to do that.
Rui
/ March 9, 2016hi, it is very helpful. i have a few .spj files to run and can i run them all in one bat file?
Many thanks
apwheele
/ March 9, 2016Yep you can do that. I can’t say off-hand if that is better than putting the code in one spj file – but I can imagine needing to intermix different tools so it would be necessary. For a hypothetical example if you needed to run SPSS, then download a file based on that intermediate result, and then run a subsequent job – or other types of control flow within the bat file.
AM
/ December 1, 2016My bat file isn’t working though 😦
When I double click on it – SPSS launches but the .spj file is not executed.
apwheele
/ December 1, 2016Do you have the “-production silent” option specified? I can’t help too much more without specifics – feel free to ask your question on the Nabble group, http://spssx-discussion.1045642.n5.nabble.com/, but they will need more info. to help.
AM
/ December 1, 2016I didn’t. I do now and its working. Thank you for replying and for sharing what you know. I thought the production silent just meant SPSS would run in the background/silently but evidently it is crucial to the code working.