
Just a quick blog post today. As a bit of a side project at work I have been looking into medical service provider deserts. Most people simply use a geographic cutoff of say 1 mile (see Wissah et al., 2020 for example for Pharmacy deserts). Also for CJ folks, John Hipp has done some related work for parolees being nearby service providers (Hipp et al., 2009; 2011), measuring nearby as 2 miles.
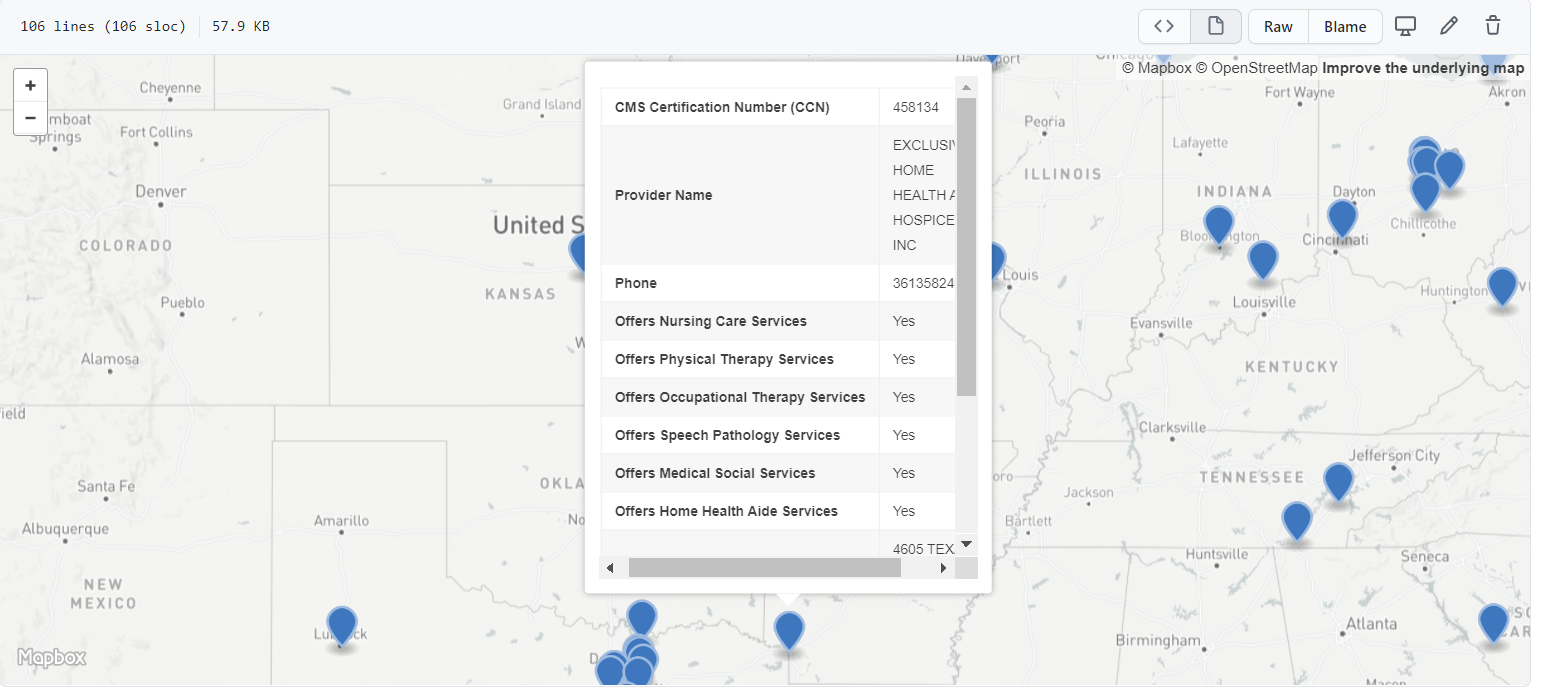
So I wrote some code to calculate nice sequential buffer areas and dissolve them in geopandas. Files and code to showcase are here on GitHub. First, as an example dataset, I geocode (using the census geocoding API) CMS certified Home Healthcare facilities, so these are hospice facilities. To see a map of those facilities across the US, and you can click on the button to get info, go to here, CMS HOME FACILITY MAP. Below is a screenshot:
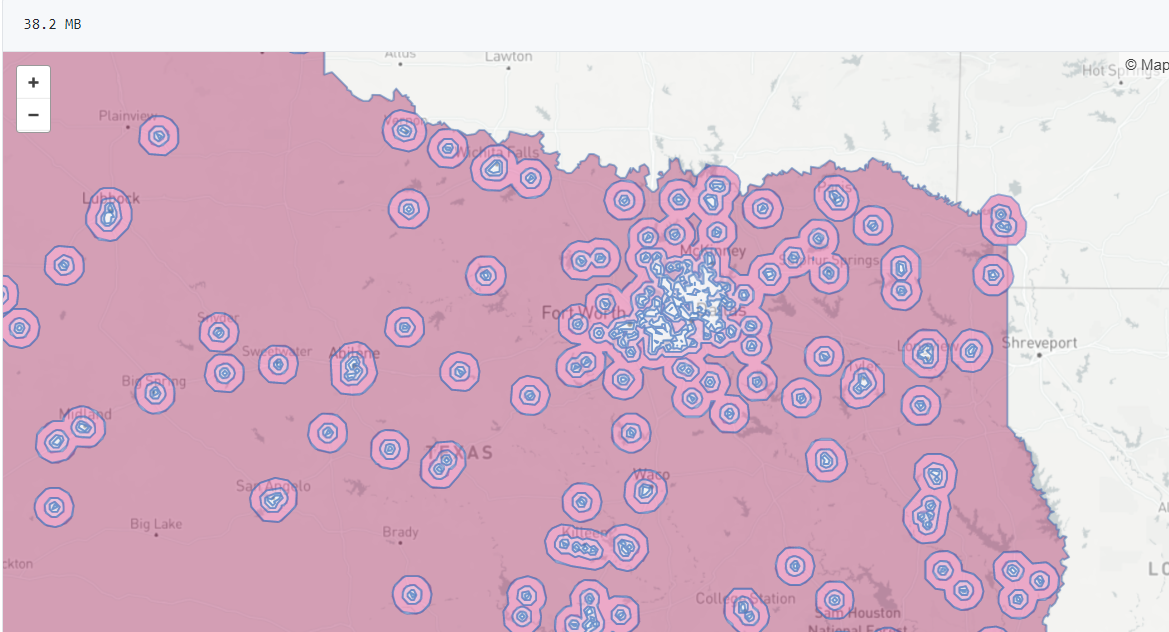
Next I then generate sequential buffers in kilometers of 2, 4, 8, 16, and then the leftover (just for Texas). So you can then zoom in and darker areas are at a higher risk of not having a hospice facility nearby. HOSPICE DESERT MAP
Plotting some of these in Folium were giving me fits, so I will need to familiarize myself with that more in the future. The buffers for the full US as well were giving me trouble (these just for Texas result in fairly large files, surprised Github doesn’t yell at me for them being too big).
Going forward, what I want to do is instead of relying on a fixed function of distance, is to fit a model to identify individuals probability of going to the doctor based on distance. So instead of just saying 1+ mile and you are at high risk, fit a function that defines that distance based on behavioral data (maybe using insurance claims). Also I think the distances matter quite a bit for urban/rural and car/no-car. So rural folks traveling a mile is not a big deal, since you need a car to really do anything in rural areas. But for folks in the city relying on public transportation going a mile or two is a bigger deal.
The model then would be similar to the work I did with Gio on gunshot death risk (Circo & Wheeler, 2020), although I imagine the model would spatially vary (so maybe geographically weighted regression may work out well).
References
- Circo, G. M., & Wheeler, A. P. (2020). Trauma Center Drive Time Distances and Fatal Outcomes among Gunshot Wound Victims. Applied Spatial Analysis and Policy, Online First.
- Hipp, J. R., Jannetta, J., Shah, R., & Turner, S. (2009). Parolees’ physical closeness to health service providers: A study of California parolees. Health & Place, 15(3), 679-688.
- Hipp, J. R., Jannetta, J., Shah, R., & Turner, S. (2011). Parolees’ physical closeness to social services: A study of California parolees. Crime & Delinquency, 57(1), 102-129.
- Wisseh, C., Hildreth, K., Marshall, J., Tanner, A., Bazargan, M., & Robinson, P. (2020). Social Determinants of Pharmacy Deserts in Los Angeles County. Journal of Racial and Ethnic Health Disparities, Online First.


Jeff Boggs
/ January 29, 2021I had students work on an assignment where they examined the claims that there was a dental desert in Ontario, and subsidary claims that it was associated with some combination of rurality, low-income or visible minorities. I don’t know if I will use the assignment this year, but if I do, I will point my students toward this blog post for inspiration (to a point; we are using QGIS).
apwheele
/ January 29, 2021I actually found a better file that is more comprehensive in terms of CMS certified providers (so only US). The NPI registry, https://download.cms.gov/nppes/NPI_Files.html or https://npiregistry.cms.hhs.gov/. You can subset by more specializations from that data file, so can do things like pharmacies, drug treatment, etc.
I will need to do a blog post about geocoding that data in the near future.