
I’ve substantially updated the aoristic macro for SPSS from what I previously posted. The updated code can be found here. The improvements are;
- Code is much more modularized, it is only 1 function and takes an
Intervalparameter to determine what interval summaries you want. - It includes Agresti-Coull binomial error intervals (95% Confidence Intervals). It also returns a percentage estimate and the total number of cases the estimate is based off of, besides the usual info for time period, split file, and the absolute aoristic estimate.
- allows an optional command to save the reshaped long dataset
Functionality dropped are default plots, and saving of begin, end and middle times for the same estimates. I just didn’t find these useful (besides academic purposes).
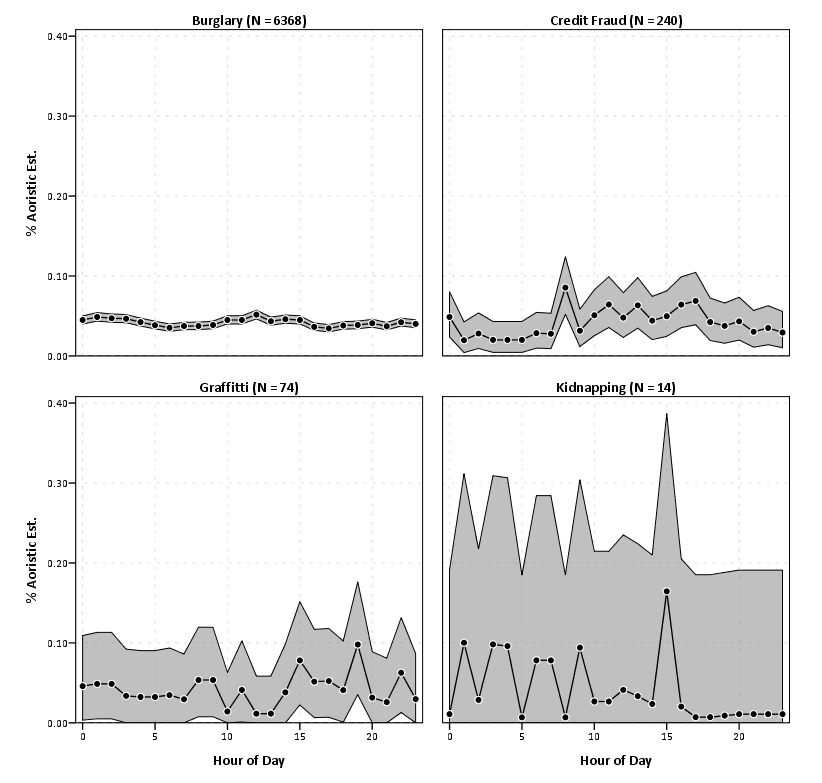
The main motivation was to add in error bars, as I found when I was making many of these charts it was obvious that some of the estimates were highly variable. While the Agresti-Coull binomial proportions are not entirely justified in this novel circumstance, they are better than nothing to at least illustrate the error in the estimates (it seems to me that they will likely be too small if anything, but I’m not sure).
I think a good paper I might work on in the future when I get a chance to is 1) show how variable the estimates are in small samples, and 2) evaluate the asympotic coverages of various estimators (traditional binomial proportions vs. bootstrap I suppose). Below is an example output of the updated macro, again with the same data I used previously. I make the small multiple chart by different crime types to show the variability in the estimates for given sample sizes.


3 Comments