
My prior rootogram post Jon Peck made the astute comment that rootograms typically are plotted on a square root scale. (Which should of been obvious to me given the name!) The reason for a square root scale for rootograms is visualization purposes, the square root scale gives more weight to values nearby 0 and shrinks values farther away from 0.
SPSS can not have negative values on a square root scale, but you can make a custom scale using ggplot2 and the scales package in R for this purpose. Here I just mainly replicated this short post by Paul Hiemstra.
So in R, first we load the scales and the ggplot2 package, and then create our custom scale function. Obviously the square root of a negative value is not defined for real numbers, so what we do is make a custom square root function. The function simply takes the square root of the absolute value, and then multiplies by the sign of the original value. This function I name S_sqrt (for signed square root). We also make its inverse function, which is named IS_sqrt. Finally I make a third function, S_sqrt_trans, which is the one used by the scales package.
library(scales)
library(ggplot2)

S_sqrt <- function(x){sign(x)*sqrt(abs(x))}
IS_sqrt <- function(x){x^2*sign(x)}
S_sqrt_trans <- function() trans_new("S_sqrt",S_sqrt,IS_sqrt)
Here is a quick example data set in R to work with.
#rootogram example, see http://stats.stackexchange.com/q/140473/1036
MyText <- textConnection("
Dist Val1 Val2
1 0.03 0.04
2 0.12 0.15
3 0.45 0.50
4 0.30 0.24
5 0.09 0.04
6 0.05 0.02
7 0.01 0.01
")
MyData <- read.table(MyText,header=TRUE)
MyData$Hang <- MyData$Val1 - MyData$Val2
And now we can make our plots in ggplot2. First the linear scale, and second update our plot to the custom square root scale.
p <- ggplot(data=MyData, aes(x = as.factor(Dist), ymin=Hang, ymax=Val1)) +
geom_hline(aes(yintercept=0)) + geom_linerange(size=5) + theme_bw()
p
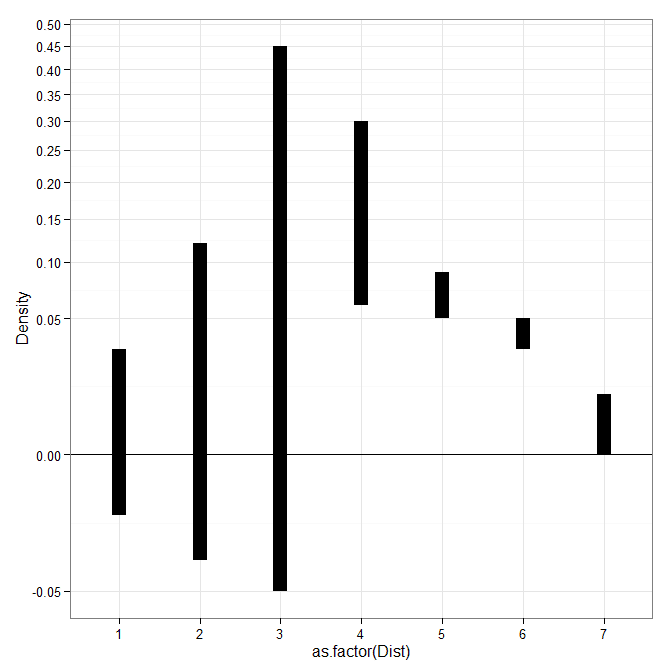
p2 <- p + scale_y_continuous(trans="S_sqrt",breaks=seq(-0.1,0.5,0.05), name="Density")
p2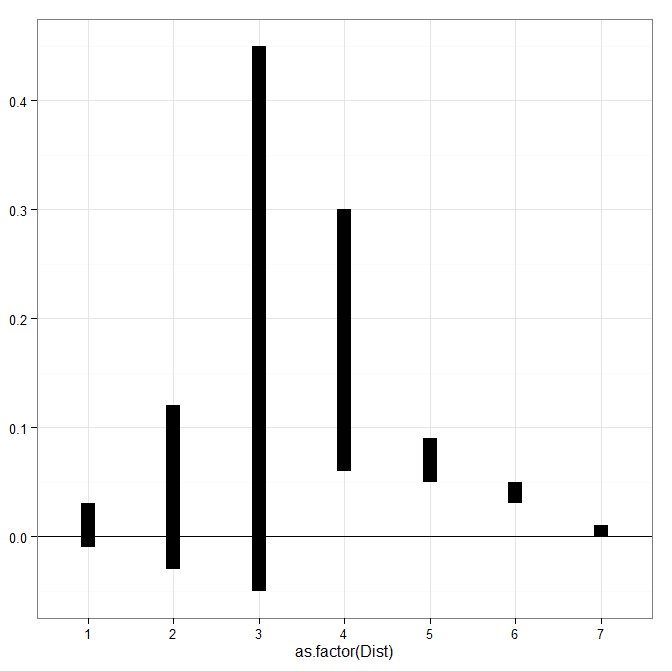


Adan Z Becerra
/ September 7, 2019would you have something similar for log base 10?
a <- function(x){sign(x)*log(abs(x),10)}
b<- function(x){10^x*sign(x)}
ab_trans <- function() trans_new("a",a,b)
would that work?