
My paper, Choosing representatives to deliver the message in a group violence intervention, is now published online at the Justice Evaluation Journal. For those who don’t have access to that journal, here is a link good for 50 e-prints (for a limited time), and here is a pre-print version, and you can always send me an email for the published copy.
I’ve posted Python code to replicate the analysis, including the original network nodes and edges group data. I figured I would go through a quick example of applying the code for others to use the algorithm.
The main idea is that for a focused deterrence initiative, for the call-ins you want to identify folks to spread the deterrence message around the network. When working with several PDs I figured looking at who was called in would be interesting. Literally the first network graph I drew was below on the left — folks who were called in are the big red squares. This was one of the main problem gangs, and the PD had done several call-ins for over a year at this point. Those are not quite the worst set of four folks to call-in based on the topology of the network, but damn close.
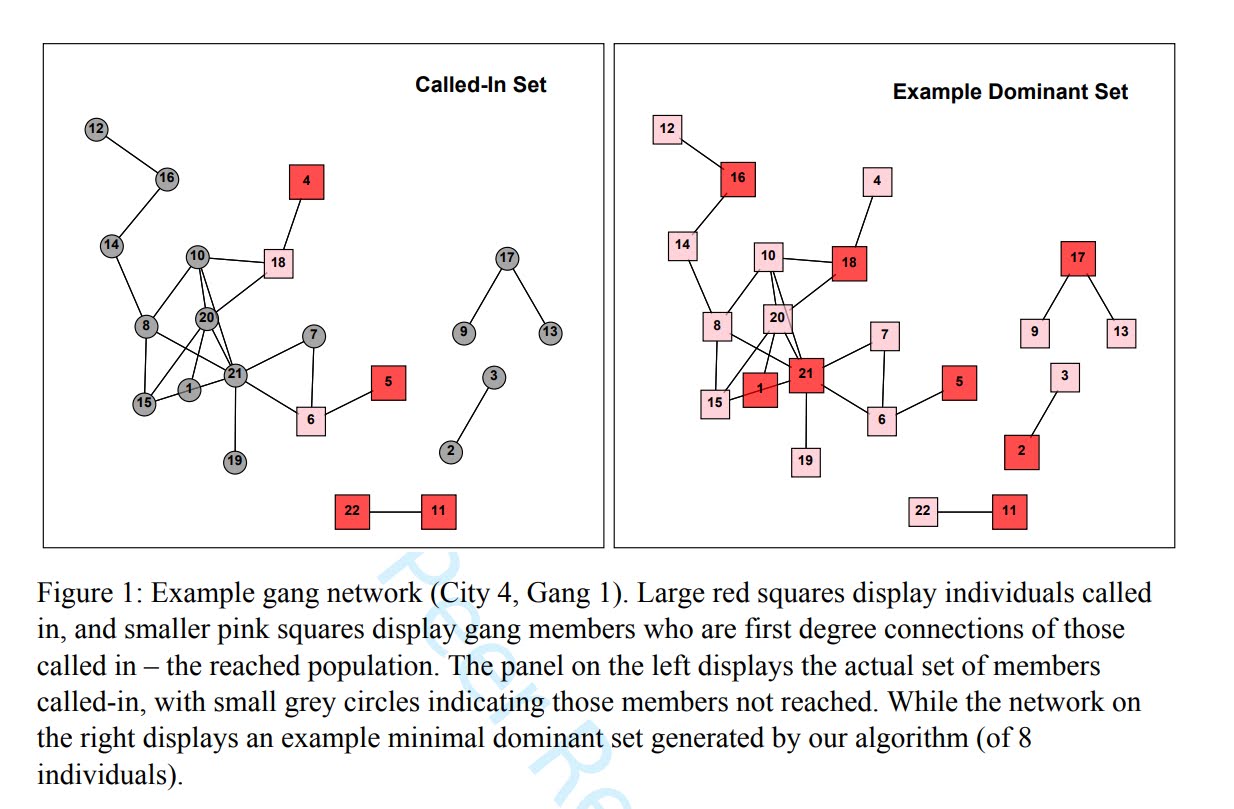
But to criticize the PD I need to come up with a better solution — which is the graph on the right hand side. The larger red squares are my suggested call-ins, and they reach everyone within one step. That means everyone is at most just one link away from someone who attended the call-in. This is called a dominant set of a graph when all of the graph is colored in.
Below I give a quicker example using my code for others to generate the dominant set (instead of going through all of the replication analysis). If you are a PD interested in applying this for your focused deterrence initiative let me know!
So first to set up your python code, I import all of the needed libraries (only non-standard is networkx). Then I import my set of functions, named MyFunctions.py, and then change the working directory.
############################################################
#The libraries I need

import itertools
import networkx as nx
import csv
import sys
import os

#Now importing my own functions I made
locDir = r'C:\Users\axw161530\Dropbox\Documents\BLOG\DominantSet_Python'
sys.path.append(locDir)
from MyFunctions import *

#setting the working directory to this location
os.chdir(locDir)
#print(os.getcwd())
############################################################
The next part I read in the CSV data for City 4 Gang 1, both the nodes and the edges. Then I create a networkx graph simply based on the edges. Technically I do not use the node information at all for this, just the edges that list a source and a target.
############################################################
#Reading in the csv files that have the nodes and the edges
#And turning into a networkX graph

#simple function to read in csv files
def ReadCSV(loc):
    tup = []
    with open(loc) as f:
        z = csv.reader(f)
        for row in z:
            tup.append(tuple(row))
    return tup

#Turning my csv files into networkx objects

nd = ReadCSV('Nodes_City4_Gang1.csv')
ed = ReadCSV('Edges_City4_Gang1.csv')
head_node = nd.pop(0) #First row for both is a header
head_edge = ed.pop(0)

#Turning my csv files into networkx objects
C1G4 = nx.Graph()
C1G4.add_edges_from(ed)
############################################################
Now it is quite simple, to get my suggested dominant set it is simple as this function call:
ds_C1G4 = domSet_Whe(C1G4)
print(ds_C1G4)
In my current session this gives the edges ['21', '18', '17', '16', '3', '22', '20', '6']. Which if you look to my original graph is somewhat different, but all are essentially single swaps where the best node to choose is arbitrary.
I have a bunch of other functions in the analysis, one of interest will be given who is under probation/parole who are the best people to call in (see the domSet_WheSub function). Again if you are interested in pursuing this further always feel free to reach out to me.


Nav
/ April 15, 2022I would like to know more about the code in python to find a dominant set, how can i contact you to talk about it?
apwheele
/ April 15, 2022My email is apwheele@gmail.com, https://andrewpwheeler.com/about/