
Recently I presented my work (with Jerry Ratcliffe) on the Weighted Displacement Difference test at the New York State GIVE Symposium. My talk fit right in with what the folks at the American Society of Evidence Based Police discussed as well. In particular, Jason Potts and Jeremiah Johnson gave a talk about how officers can conduct their own experiments, and my work provides a simple tool to test if changes over time are significant or just due to chance.
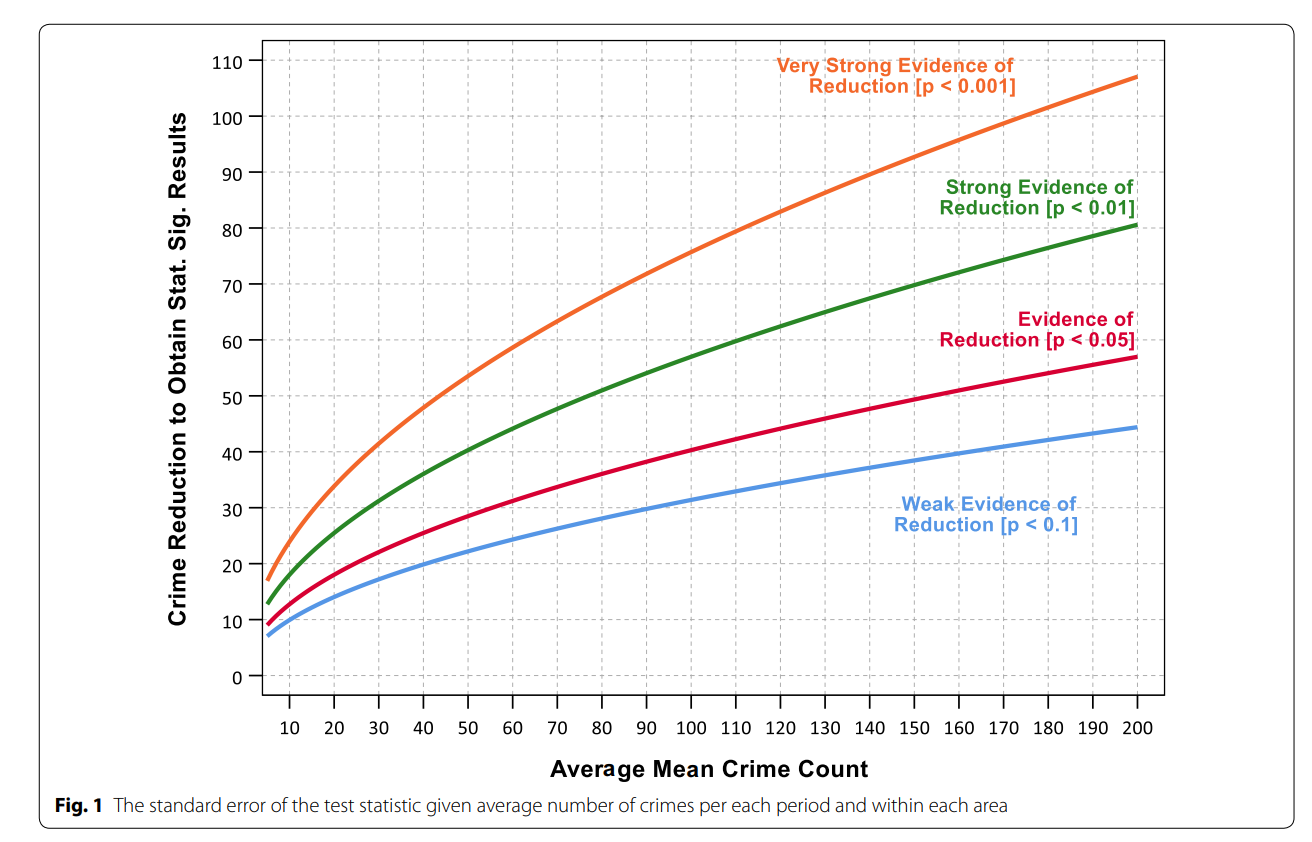
There was one point of contention though between us — ASEBP folks advocate for the failing fast model of evaluation, whereas I advocated for planning more long term experiments. In particular, I suggest this chart to plan your experiments. So say if you have an area with only 10 crimes per month, I would suggest you should do the experiment for at least 4 months, so if what your are doing is 50% effective at reducing crime, you will conclude it has at least weak evidence of effectiveness using my WDD test. If you think 50% is too high of a bar, if you do it for 12 months it only needs to be alittle over 25% effective to tell if it is working.
The ideal behind failing fast and innovating I totally get, but whether or not we can actually see if something is effective in the short run with low baseline crime counts may be a road block to this idea in practice. Note that this is not me bagging on people doing experiments — what is most likely to happen if you do an experiment with low power is you will conclude it is not effective, even if it partially works. So I’m more concerned the BetaGov fail fast model is likely to throw out cost-effective interventions that don’t appear on their face to be effective, as opposed to false positives.1
Am I being too negative though? And also can we create a monitoring tool to give more immediate feedback — so instead of waiting a year and seeing the results, evaluating the efficacy of an intervention over time? To do this I am giving cusum charts a try, and did a little simulation to show how it might look in practice. SPSS Code to replicate the findings here.
So what I did was simulate a baseline control area with 10 crimes per time period, and a treated area that had a 20% reduction (so goes down to 8 crimes on average per time period). Here is the time series of those two areas, black line is the control area, and red line is the treated area. Time periods can be whatever you want (e.g. days, weeks, months), what matters is the overall average and the difference between the two series.
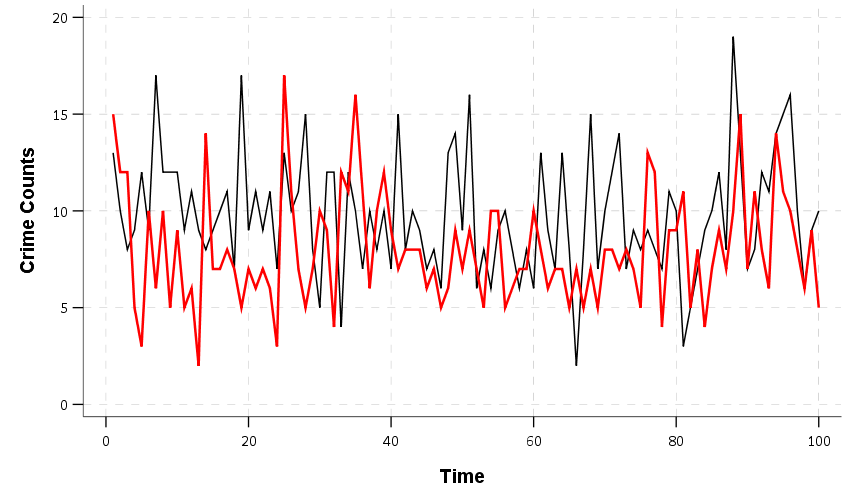
Based on this graph, you can’t really visually tell if the red treated area is doing any better than the black control area — they overlap too much. But we aren’t just interested in the effect for any one time period, but in the cumulative effect over time. To calculate that, you just subtract the black line from the red line, and take the cumulative sum of that difference. The next chart shows that statistic, along with 100 simulated lines showing what happens when you do the same cumulative statistic to data with no changes.
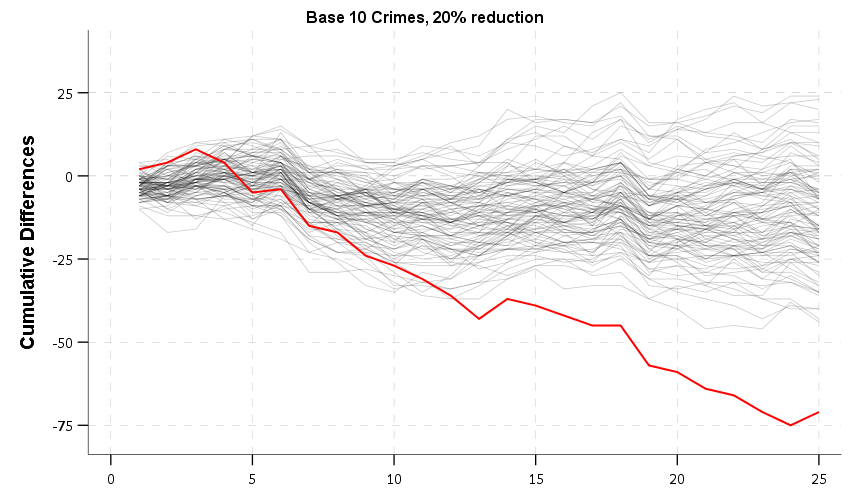
So you can see here that it takes about 13 time periods to show the cumulative effects are outside of the simulation boundaries, but you might conclude there is suggestive evidence of effectiveness after say 8+ time periods. Going further out it still shows the cumulative number of crimes prevented over the life of the intervention, so goes down to around 75 crimes prevented by 25 time periods.
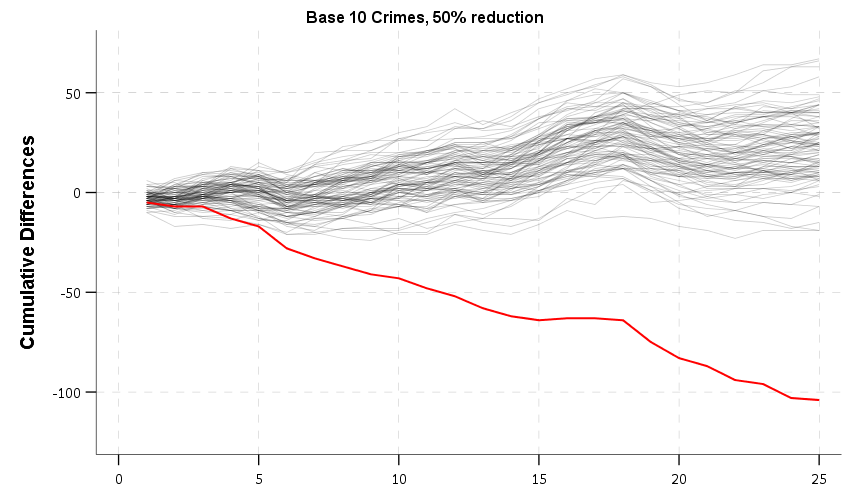
The number of time periods necessary to show divergence is dependent on how effective the intervention is. So if we have the same baseline average of 10 crimes per time period, but the intervention is 50% effective (so reduces to an average of 5 crimes per time period), you can tell it diverges by period 6 in this second simulation example.
If we go back to my power chart I made for the WDD test, you can see that these effective time periods are close to my power chart suggestions for the weak evidence line. So this cusum approach is maybe slightly more diagnostic, and has the benefit you may be able to stop the experiment early if it is really effective.
You should still commit to running the experiment though for a set amount of time. The amount of time should be based on how effective you think the experiment should be, as well as cost-benefit analyses. If something costs alot of money (e.g. overtime) the effectiveness threshold to make it worthwhile in practice is a much higher bar than something that is closer to zero cost (such as shifting around current assignments). Given that ASEBP is advocating for lower level officers to experiment, they are more likely to be the latter type of low cost interventions.
There are still a few issues with using cusum charts like this though. One, this is very dependent on having a control area that is the same level of crime counts. So my WDD test only needs the parallel trends assumption, but this needs both the parallel trends and equal levels. (There are ways to get rid of the equal levels assumption though, one is to take the differences in differences and calculate those cusums over time.)
Another is that you need to reset cusum charts after a particular time period — you can see the simulations are random walks, and so grow much wider over time. I’m not sure at that point though if you should choose a new control area, or just stick with the prior one though. In the first example you can see the red line overestimates the effectiveness — the first chart the true estimate should be -2*time period (estimated -75 versus should be -50 after 25 time periods). For the second the true effect is -5*time period, so the estimate is a slight underestimate (estimated -100 versus should be -125 after 25 time periods).
But this is about the best meet in the middle of actively monitoring place based crime interventions and my advocacy for planning long term interventions that I can drum up for now. It is short term feedback, but you should be committed to running the experiment for a longer period of time. The sequential monitoring allows you to stop early if the intervention is really effective, see this example for A/B tests. But otherwise you are often better off just planning a long term intervention and not peek at the short term results.
Besides the technical stats portion of being able to tell if it diverges from a control area, it may also be behavioral, in that you need a longer period of time to generate deterrence, or for officers to effectively implement the strategy. You notice in these examples if you only did 5 time periods, they meander about 0 and so don’t appear to be effective. It takes longer time periods, even with the 50% effective intervention, to know if the intervention was effective given these low of baseline crime counts.
- Although with low power you do have issues with what Andrew Gelman calls type S (sign) and type M (magnitude) errors as well. That is even if you do think it is effective, you may think it is way more effective than it actually is in reality based on your noisy estimates. Or you conclude it has iatrogenic effects when it works in practice.↩


3 Comments