
This is a task I’ve have to conduct under several guises in the past. Given a set of edges, reduce those edges into unique subgroups based on the transitive closure of those edges. That is, find a group in which all nodes can reach one another (via however many steps are necessary) but are completely separated from all other nodes.
This is steeped in some network language jargon, so I will give a few examples in data analysis where this might be useful:
- Find cliques of offenders (that may resemble a gang) given a set of co-offenders in a police incident database.
- Reduce a large set of items that appear together into smaller subsets. An example may be if you have a multiple response set with a very large number of possible choices. You may identify subgroups of items that occur together.
- Given a set of linked near match names, reduce the database so all of those near match names share the same unique id.
- For my dissertation I aggregate crime incidents to street midpoints and intersections. This creates some overlap or near overlap points (e.g. at T intersections). You might want to further aggregate points that are within a prespecified distance, but there may be multiple nodes all within a short distance. These create a string of networked locations that are probably not appropriate to simply aggregate – especially when they include a large number of locations.
One (typical) way to find the transitive closure is to represent your edges in a binary adjacency matrix and then take subsequent higher powers of that matrix until the diffusion ceases. This is difficult to impossible though with node lists of any substantial size. In this post what I will do is use the NetworkX python library, which contains a handy function named components.connected that solves this problem for me.
So first for illustration lets make a small edge list in SPSS.
DATA LIST FREE / A B.
BEGIN DATA
1 2
2 3
3 4
5 6
7 8
4 9
7 9
8 10
END DATA.
DATASET NAME Test.
FORMATS A B (F5.0).
EXECUTE.
Now using the functions described in this StackOverflow post, we will be able to turn a set of nested lists into a NetworkX object in python.
BEGIN PROGRAM.
import networkx
from networkx.algorithms.components.connected import connected_components

def to_graph(l):
    G = networkx.Graph()
    for part in l:
        # each sublist is a bunch of nodes
        G.add_nodes_from(part)
        # it also imlies a number of edges:
        G.add_edges_from(to_edges(part))
    return G

def to_edges(l):
    """
        treat `l` as a Graph and returns it's edges
        to_edges(['a','b','c','d']) -> [(a,b), (b,c),(c,d)]
    """
    it = iter(l)
    last = next(it)

    for current in it:
        yield last, current
        last = current
END PROGRAM.
Now this python code 1) imports our edge list from the SPSS dataset and turn it into a networkx graph, 2) reduces the set of edges into connected components, 3) makes a new SPSS dataset where each row is a list of those subgraphs, and 4) makes a macro variable to identify the end variable name (for subsequent transformations).
DATASET DECLARE Int.
BEGIN PROGRAM.
#grab SPSS data
import spss, spssdata
alldata = spssdata.Spssdata().fetchall()

#turn SPSS data into graph
G = to_graph(alldata)
results = connected_components(G)
print results
ml = max(map(len,results))

#now make an SPSS dataset
spss.StartDataStep()
datasetObj = spss.Dataset(name='Int')
for i in range(ml):
  v = 'V' + str(i+1)
  datasetObj.varlist.append(v,0)
for j in results:
  datasetObj.cases.append(j)
spss.EndDataStep()

#make a macro value to signify the last variable
macroValue=[]
macroName="!VEnd"
macroValue.append('V' + str(ml))
spss.SetMacroValue(macroName, macroValue)
END PROGRAM.
Now we can take that subgroup dataset, named Int, reshape it so all of the nodes are in one column and has a second column identifying the subgraph to which it belongs, and then merge this info back to the edge dataset named Test.
DATASET ACTIVATE Int.
COMPUTE Group = $casenum.
FORMATS Group (F5.0).
VARSTOCASES
  /MAKE A FROM V1 TO !VEnd.
FORMATS A (F5.0).
SORT CASES BY A.

DATASET ACTIVATE Test.
SORT CASES BY A.
MATCH FILES FILE = *
  /TABLE = 'Int'
  /BY A.
EXECUTE.
From here we can make some nice sociogram charts of our subgroups. SPSS’s layout.network is not very specific about the type of layout algorithm, but it does a good job here laying out a nice planar graph.
GGRAPH
  /GRAPHDATASET NAME="edges" DATASET = "Test" VARIABLES=A B Group
  /GRAPHDATASET NAME="nodes" DATASET = "Int" VARIABLES=A Group
  /GRAPHSPEC SOURCE=INLINE.
BEGIN GPL
 SOURCE: e=userSource(id("edges"))
 DATA: Ae=col(source(e), name("A"), unit.category())
 DATA: Be=col(source(e), name("B"), unit.category())
 DATA: Groupe=col(source(e), name("Group"), unit.category())
 SOURCE: n=userSource(id("nodes"))
 DATA: An=col(source(n), name("A"), unit.category())
 DATA: Groupn=col(source(n), name("Group"), unit.category())
 GUIDE: axis(dim(1), null())
 GUIDE: axis(dim(2), null())
 GUIDE: legend(aesthetic(aesthetic.color.interior), null())
 ELEMENT: edge(position(layout.network(node(An), from(Ae), to(Be))))
 ELEMENT: point(position(layout.network(node(An), from(Ae), to(Be))), color.interior(Groupn), size(size."14"), label(An))
END GPL.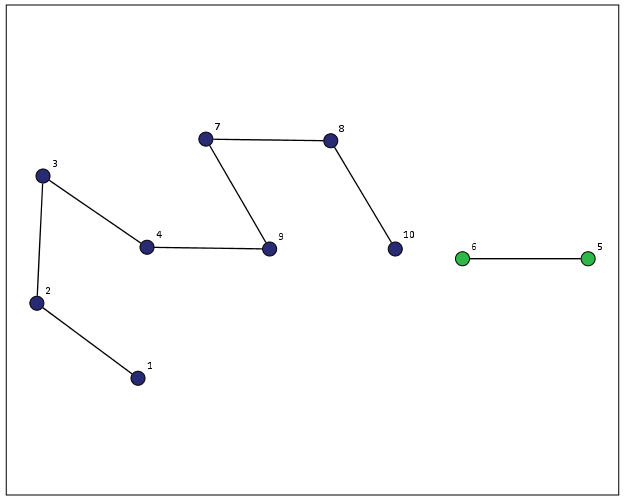
At the end of the post I have some more code to illustrate this with a slightly larger random network of 300 potential nodes and 100 random edges. Again SPSS does quite a nice job of laying out the graph, and the colors by group reinforce that our solution is correct.
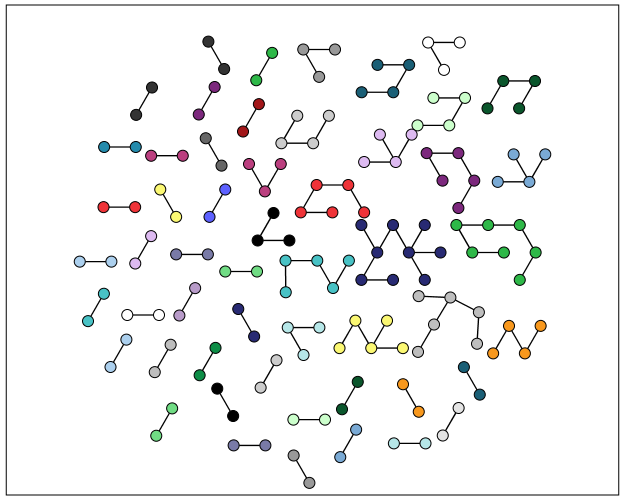
My most recent use application for this had a set of 2,000+ plus edges and this code returned the solution instantaneously. Definitely a speed improvement over taking powers of a binary adjacency matrix in MATRIX code.
I wanted to make this network graph using small multiples by group, but I can’t figure out the correct code for the faceting (example commented out at the end of the code snippet). So if anyone has an example of making an SPSS graph with small multiples let me know.
*Similar graphs for larger network.
DATASET CLOSE ALL.
INPUT PROGRAM.
COMPUTE #Nodes = 300.
LOOP #i = 1 TO 100.
  COMPUTE A = TRUNC(RV.UNIFORM(0,#Nodes+1)).
  COMPUTE B = TRUNC(RV.UNIFORM(0,#Nodes+1)).
  END CASE.
END LOOP.
END FILE.
END INPUT PROGRAM.
DATASET NAME Test.
FORMATS A B (F5.0).
EXECUTE.

DATASET DECLARE Int.
BEGIN PROGRAM.
#grab SPSS data
import spss, spssdata
alldata = spssdata.Spssdata().fetchall()

#turning SPSS data into NetworkX graph
#functions are already defined
G = to_graph(alldata)
results = connected_components(G)
ml = max(map(len,results))
print ml

#now make an SPSS dataset
spss.StartDataStep()
datasetObj = spss.Dataset(name='Int')
for i in range(ml):
  v = 'V' + str(i+1)
  datasetObj.varlist.append(v,0)
for j in results:
  datasetObj.cases.append(j)
spss.EndDataStep()

#make a macro value to signify the last variable
macroValue=[]
macroName="!VEnd"
macroValue.append('V' + str(ml))
spss.SetMacroValue(macroName, macroValue)
END PROGRAM.

*Now merging groups back into original set.
DATASET ACTIVATE Int.
COMPUTE Group = $casenum.
FORMATS Group (F5.0).
VARSTOCASES
  /MAKE A FROM V1 TO !VEnd.
FORMATS A (F5.0).
SORT CASES BY A.

DATASET ACTIVATE Test.
SORT CASES BY A.
MATCH FILES FILE = *
  /TABLE = 'Int'
  /BY A.
EXECUTE.

GGRAPH
  /GRAPHDATASET NAME="edges" DATASET = "Test" VARIABLES=A B Group
  /GRAPHDATASET NAME="nodes" DATASET = "Int" VARIABLES=A Group
  /GRAPHSPEC SOURCE=INLINE.
BEGIN GPL
 SOURCE: e=userSource(id("edges"))
 DATA: Ae=col(source(e), name("A"), unit.category())
 DATA: Be=col(source(e), name("B"), unit.category())
 DATA: Groupe=col(source(e), name("Group"), unit.category())
 SOURCE: n=userSource(id("nodes"))
 DATA: An=col(source(n), name("A"), unit.category())
 DATA: Groupn=col(source(n), name("Group"), unit.category())
 GUIDE: axis(dim(1), null())
 GUIDE: axis(dim(2), null())
 GUIDE: legend(aesthetic(aesthetic.color.interior), null())
 ELEMENT: edge(position(layout.network(node(An), from(Ae), to(Be))))
 ELEMENT: point(position(layout.network(node(An), from(Ae), to(Be))), color.interior(Groupn), size(size."11"))
END GPL.

*This small multiple faceting is not working.
*Error is Groupe & Groupn are not same faceting structure.
 * GGRAPH
  /GRAPHDATASET NAME="edges" DATASET = "Test" VARIABLES=A B Group
  /GRAPHDATASET NAME="nodes" DATASET = "Int" VARIABLES=A Group
  /GRAPHSPEC SOURCE=INLINE.
 * BEGIN GPL
 SOURCE: e=userSource(id("edges"))
 DATA: Ae=col(source(e), name("A"), unit.category())
 DATA: Be=col(source(e), name("B"), unit.category())
 DATA: Groupe=col(source(e), name("Group"), unit.category())
 SOURCE: n=userSource(id("nodes"))
 DATA: An=col(source(n), name("A"), unit.category())
 DATA: Groupn=col(source(n), name("Group"), unit.category())
 GUIDE: axis(dim(1), null())
 GUIDE: axis(dim(2), null())
 GUIDE: legend(aesthetic(aesthetic.color.interior), null())
 ELEMENT: edge(position(layout.network(1*1*Groupe, node(An), from(Ae), to(Be))))
 ELEMENT: point(position(layout.network(1*1*Groupn, node(An), from(Ae), to(Be))), color.interior(Groupn), size(size."14"), label(An))
END GPL.

suman pandey
/ February 8, 2016How to find positive and negative subgraph and positive (negative) edges from given network dataset by using networkX (python) please help me
apwheele
/ February 9, 2016Hi suman – here (and on the IBM blog) these are just general networkx questions. You should ask them at a general python or networkx forum – or pay someone to do this work. This has nothing to do with the example I gave. If you can provide a work workable example stackoverflow would be an ok place to ask such a question.