
Sometimes there are calculations provided for in SPSS tables that are necessary to use for other calculations. A frequent one is to grab certain percentiles from a FREQUENCY table (Equal Probability Histograms in SPSS is one example). The typical way to do this is to grab the table using OMS, but where that is overkill is if you need to merge this info. back into the original data for further calculations. I will show a brief example of grabbing the 25th, 50th, and 75th percentiles from a frequency table and using Python to calculate a robust standardized variable using these summary statistics.
First we will make a set of random data to work with.
SET SEED 10.
MATRIX.
SAVE {UNIFORM(100,1)} /OUTFILE = *.
END MATRIX.
DATASET NAME U.
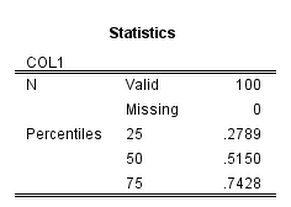
FREQ COL1 /FORMAT = NOTABLE /PERCENTILES = 25 50 75.The frequency table we are working with then looks like:
Now to get to the items in this frequency table we just to do a bit of going down a rabbit hole of different python objects.
- The first block grabs the items in the output, which include tables and text.
- The second block then grabs the last table for this specific output. Note that minus 2 from the size of the list is necessary because Python uses zero based indices and there is a log item after the table. So if the size of the list is 10, that means
list[9]is the last item in the list. (Using negative indices does not work for extracting from the OutputItemList object.) - The third part then grabs the quantiles from the indices of the table. It ends up being in the first data column (so zero) and in the 3rd, 4th and 5th rows (again, Python uses zero based indices). Using
GetUnformattedValueAtgrabs the floating point number. - The final part then uses these quantiles to calculate a robust normalized variable by using
spss.Submitand string substitution. (And then closes the SPSS client at the end.)
BEGIN PROGRAM Python.
import SpssClient, spss

#start the client, grab the items in the output
SpssClient.StartClient()
OutputDoc = SpssClient.GetDesignatedOutputDoc()
OutputItemList = OutputDoc.GetOutputItems()

#Grab the last table, 0 based index
lastTab = OutputItemList.Size() - 2
OutputItem = OutputItemList.GetItemAt(lastTab)
PivotTable = OutputItem.GetSpecificType()
SpssDataCells = PivotTable.DataCellArray()

#Grab the specific quantiles
Q25 = float(SpssDataCells.GetUnformattedValueAt(2,0))
Q50 = float(SpssDataCells.GetUnformattedValueAt(3,0))
Q75 = float(SpssDataCells.GetUnformattedValueAt(4,0))
print [Q25,Q50,Q75]

#Use these stats in SPSS commands
spss.Submit("COMPUTE QuantNormX = ( COL1 - %(Q50)f )/( %(Q75)f - %(Q25)f )." % locals())
SpssClient.StopClient()
END PROGRAM.
While the python code in terms of complexity is just about the same as using OMS to grab the frequency table and merge the quantiles back into the original data, this will be much more efficient. I can imagine using this for other projects too, like grabbing coefficients from a regression model and estimating certain marginal effects.


camdenln
/ April 13, 2015While extracting output from the Viewer via the SpssClient apis works, it is not more efficient than using OMS. Output en route to the Viewer passes through the output factory, which is where the OMS troll lives, so letting the troll capture it and put it in the XML workspace without even letting it appear in the Viewer would be more efficient. In most cases you would probably not notice the difference, but in some contexts the SpssClient module is not available, including external mode Python access and StatisticsB. StatisticsB is part of Statistics Server and can be used to run remote jobs.
-Jon Peck
apwheele
/ April 13, 2015Sorry for not being clear, but that is not what I meant Jon. To accomplish what I did in this post with OMS, you would need to 1) extract the table with OMS, 2) then merge the quantiles back into the original dataset, and then 3) calculate the QuantNormX variable. Where I meant above is more efficient than the OMS approach is that #2 is not necessary when using python to extract the stuff out of the table.
Gustavo Zeferino
/ November 29, 2015This approach is fantastic.Thanks.
Parsing SPSS XML tables requires lots of code and time specially for custom tables since you need to study every detail in XML for each extraction.
Quant1
/ January 24, 2017Thanks so much for posting this. It was a great intro to pulling data from SPSS output. Very helpful.
I think you need an execute statement in there. At least I do with SPSS 19 and Python 2.6.
spss.Submit([“COMPUTE QuantNormX2 = ( COL1 – %(Q50)f )/( %(Q75)f – %(Q25)f ).” %locals(),”execute.”])
Javier Figueroa
/ September 30, 2020It’s just what I need.
Thank you very much.