
So awhile back had a request about how to use the random forest tool in ArcPro for crime prediction. So here I will show how to set up the data in a way to basically replicate how I used random forests in this paper, Mapping the Risk Terrain for Crime using Machine Learning. ArcPro is actually pretty nice to replicate how I set it up in that paper to do the models, but I will discuss some limitations at the end.
I am not sharing the whole project, but the data I use you can download from a prior post of mine, RTM Deep Learning style. So here is my initial data set up based on the spreadsheets in that post. So for original data I have crimes aggregated to street units in DC Prepped_Crime.csv (street units are midpoints in street blocks and intersections), and then point dataset tables of alcohol outlet locations AlcLocs.csv, Metro entrances MetroLocs.csv, and 311 calls for service Calls311.csv.
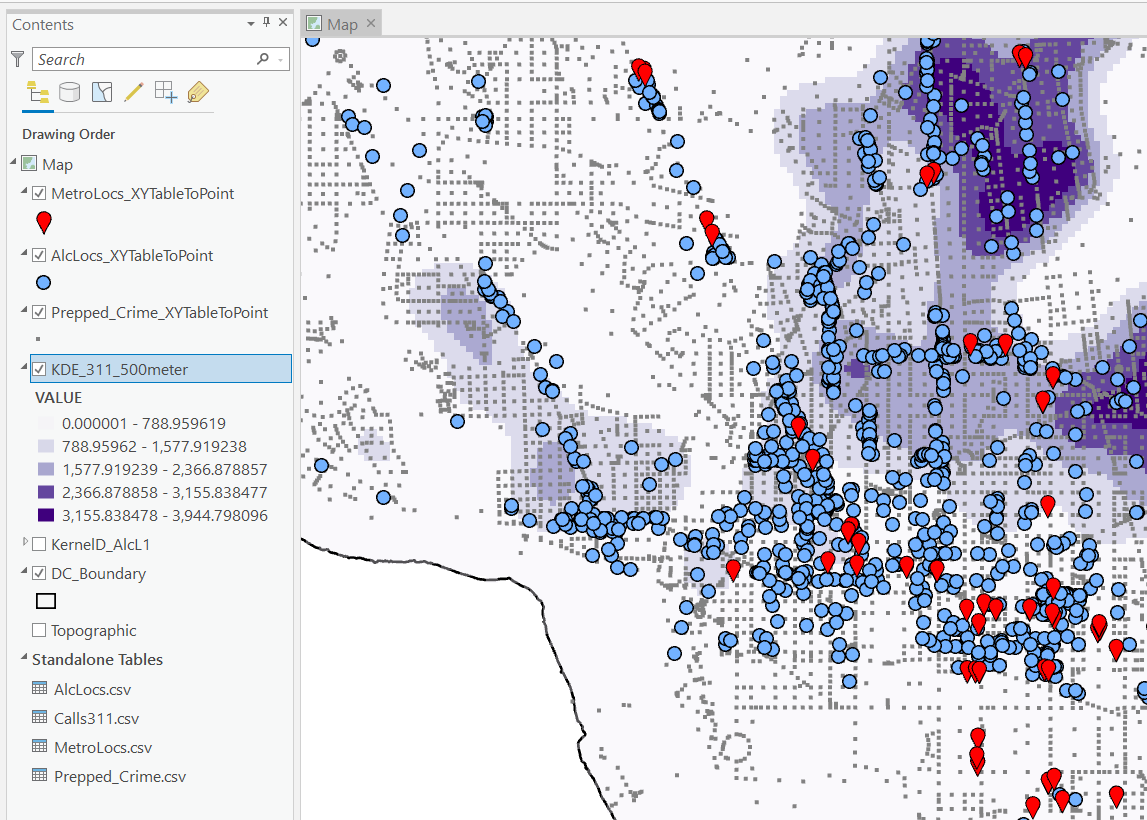
I then turn those original csv files into several spatial layers, via the display XY coordinates tool (these are all projected data FYI). On top of that you can see I have two different kernel density estimates – one for 311 calls for service, and another for the alcohol outlets. So the map is a bit busy, but above is the basic set of information I am working with.
For the crimes, these are the units of analysis I want to predict. Note that this vector layer includes spatial units of analysis even with 0 crimes – this is important for the final model to make sense. So here is a snapshot of the attribute table for my street units file.
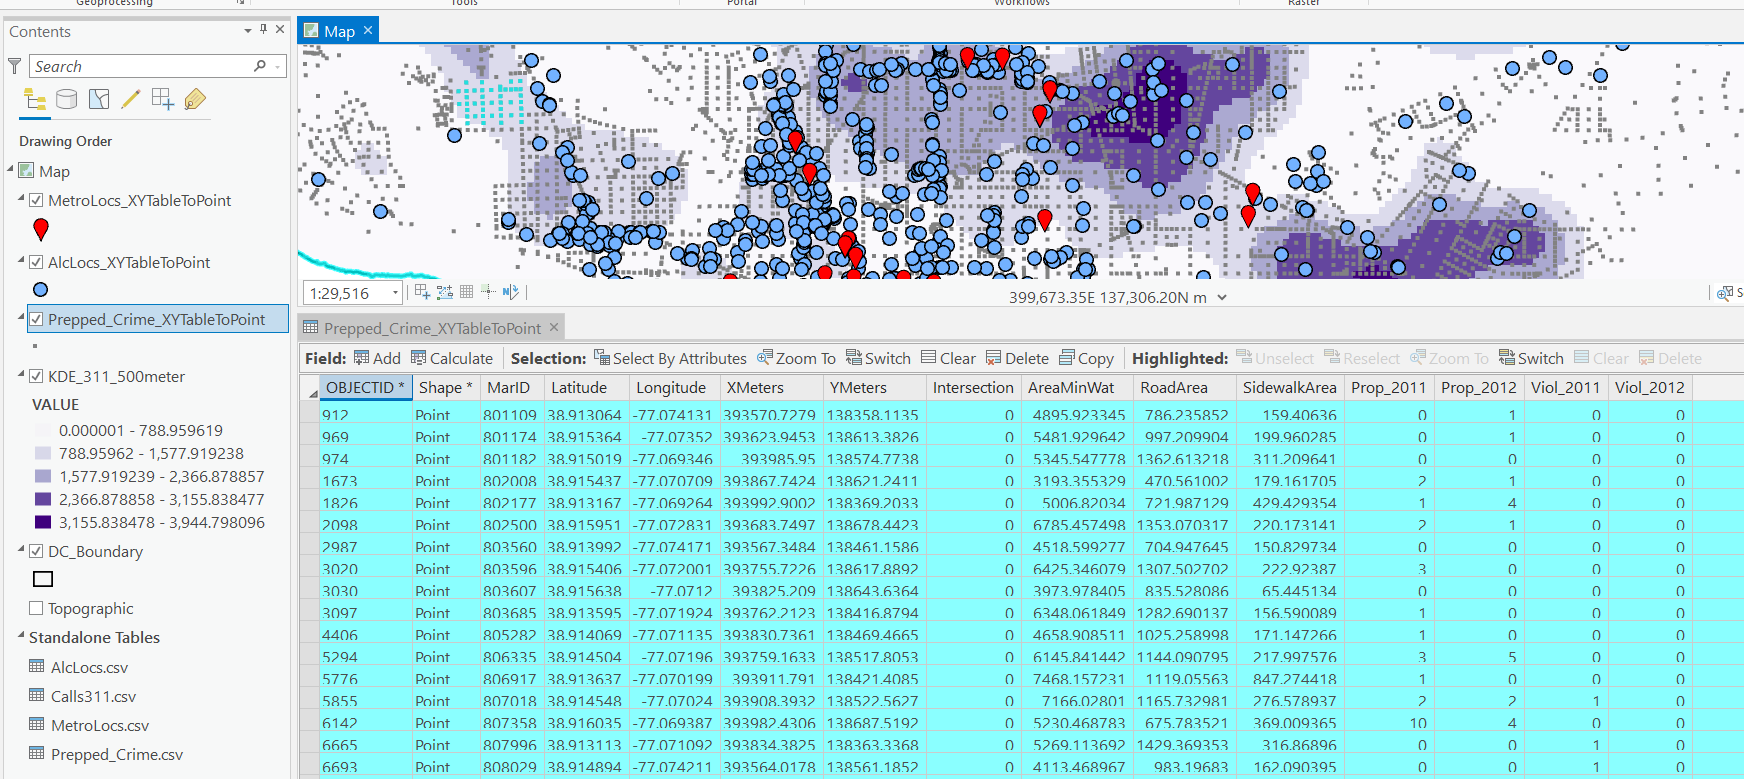
Here we are going to predict the Viol_2011 field based on other information, both other fields included in this street units table, as well as the other point/kernel density layers. So while I imagine that ArcPro can predict for raster layers as well, I believe it will be easier for most crime analysts to work with vector data (even if it is a regular grid).
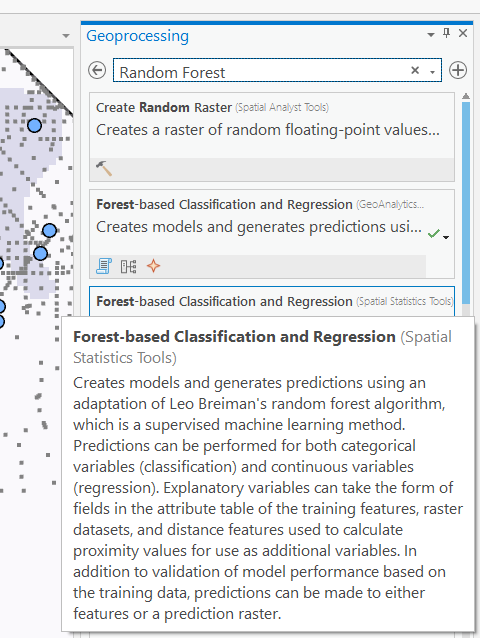
Next, in the Analysis tab at the top click the Tools toolbox icon, and you get a bar on the right to search for different tools. Type in random forest – several different tools come up (they just have slightly different GUI’s) – the one I showcase here is the Spatial Stats tools one.
So this next screenshot shows filling in the data to build a random forest model to predict crimes.
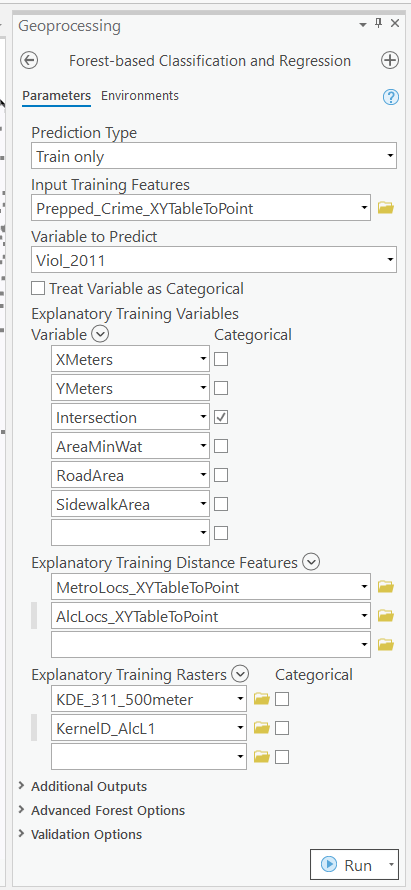
- in the input training features, put your vector layer for the spatial units you want to predict. Here mine is named
Prepped_Crime_XYTableToPoint. - Select the variable to predict,
Viol_2011. The options are columns in the input training features layer. - Explanatory Training Variables are additional columns in your vector layer. Here I include the XY locations, whether a street unit is an intersection, and then several different area variables. These variables are all calculated outside of this procedure.
Note for the predictions, if you just have 0/1 data, you can change the variable to predict as categorical. But later on in determining hotspots you will want to use the predicted probability from that output, not the binary final threshold.
For explanatory variables, here it is ok to use the XY coordinates, since I am predicting for the same XY locations in the future. If I fit a model for Dallas, and then wanted to make predictions for Austin, the XY inputs would not make sense. Finally it is OK to also include other crime variables in the predictions, but they should be lagged in time. E.g. I could use crimes in 2010 (either violent/property) to predict violent crimes in 2011. This dataset has crimes in 2012, and we will use that to validate our predictions in the end.
Then we can also include traditional RTM style distance and kernel density inputs as well into the predictions. So we then include in the training distance features section our point datasets (MetroLocs and AlcLocs), and in our training rasters section we include our two kernel density estimates (KDE_311 calls and KernelD_AlcL1 is the kernel density for alcohol outlets).
Going onto the next section of filling out the random forest tool, I set the output for a layer named PredCrime_Test2, and also save a table for the variable importance scores, called VarImport2. The only other default I change is upping the total number of trees, and click on Calculate Uncertainty at the bottom.
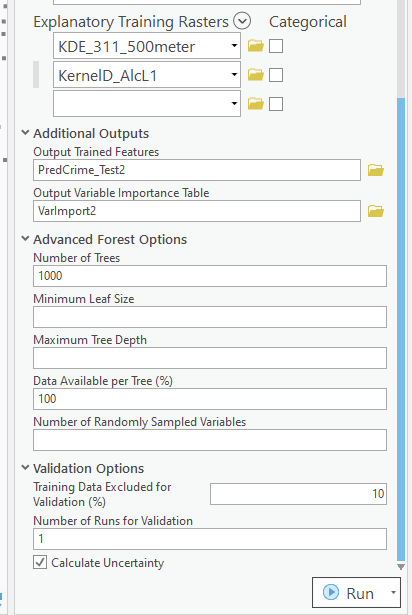
My experience with Random Forests, for binary classification problems, it is a good idea to set the minimum leaf size to say 50~100, and the depth of the trees to 5~10. But for regression problems, regulating the trees is not necessarily as big of a deal.
Click run, and then even with 1000 trees this takes less than a minute. I do get some errors about missing data (should not have done the kernel density masked to the DC boundary, but buffered the boundary slightly I think). But in the end you get a new layer, here it is named PredCrime_Test2. The default symbology for the residuals is not helpful, so here I changed it to proportional circles to the predicted new value.
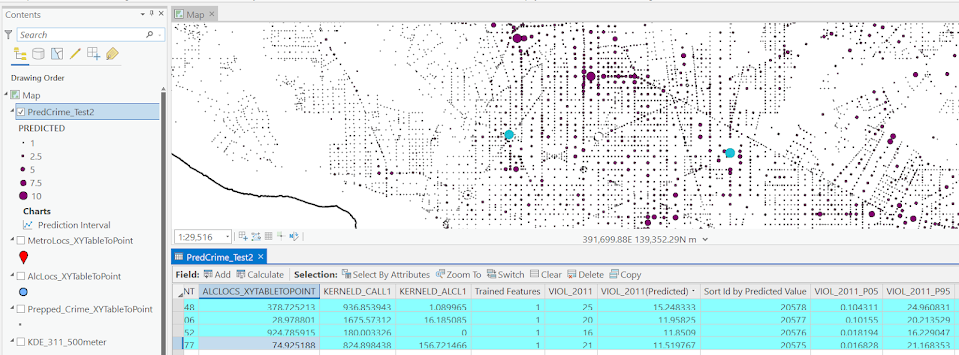
So you would prioritize your hotspots based on these predicted high crime areas, which you can see in the screenshot are close to the historical ranks but not a 100% overlap. Also this provides a potentially bumpy (but mostly smoothed) set of predicted values.
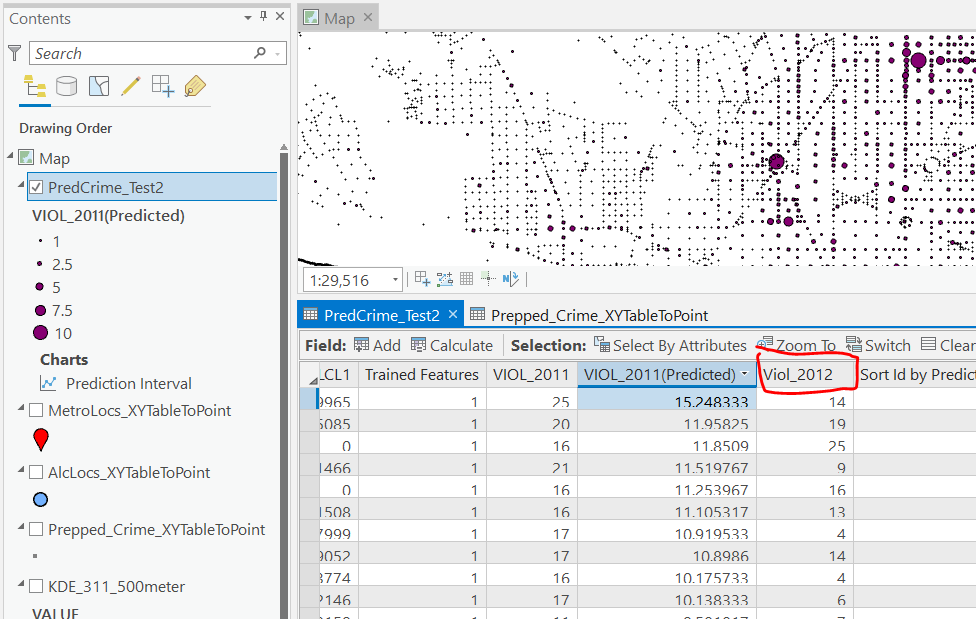
Next what I did was a table join, so I could see the predicted values against the future 2012 violent crime data. This is just a snap shot, but see this blog post about different metrics you can use to evaluate how well the predictions do.
Finally, we saved the variable importance table. I am not a big fan of these, these metrics are quite volatile in my experience. So this shows the sidewalk area and kernel density for 311 calls are the top two, and the metro locations distance and intersection are at the bottom of variable importance.
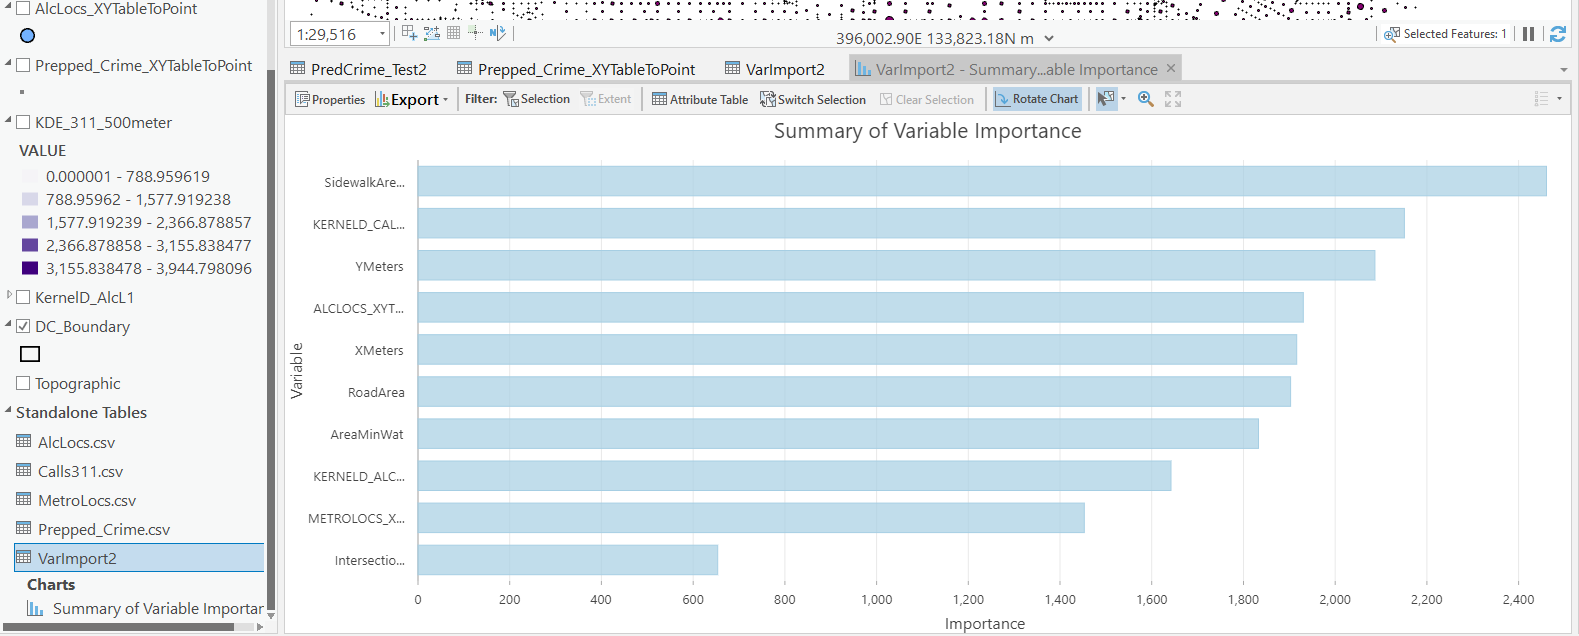
But these I don’t think are very helpful in the end (even if they were not volatile). For example even if 311 calls for service are a good predictor, you can have a hot spot without a large number of 311 calls nearby (so other factors can combine to make hotspots have different factors that contribute to them being high risk). So I show in my paper linked at the beginning how to make reduced form summaries for hot spots using shapely values. It is not possible using the ArcPro toolbox (but I imagine if you bugged ESRI enough they would add this feature!).
This example is for long term crime forecasting, not for short term. You could do random forests for short term, such as predicting next week based on several of the prior weeks data. This would be more challenging to automate though in ArcPro environment I believe than just scripting it in R or python IMO. I prefer the long term forecasts though anyway for problem oriented strategies.


Odhinn Kohout
/ March 26, 2021Beyond helpful…thank you!
Barbara Monserrat Ramos Macias
/ June 28, 2024Awesome work! Thanks for sharing it