
I’ve currently made a vizualization intended to be an exploratory tool to identify overlapping criminal events over a short period. Code to reproduce the macro is here, and that includes an example with made up data. As opposed to aoristic analysis, which lets you see globally the aggregated summaries of when crime events occurred potentially correcting for the unspecified time period, this graphical procedure allows you to identify whether local events overlap. It also allows one to perceive global information as well, in particular whether the uncertainty of events occur in morning, afternoon, or night.
A call to the macro ends up looking like this (other vars is optional and can include multiple variables – I assume token names are self-explanatory);
!interval_data date_begin = datet_begin time_begin = XTIMEBEGIN date_end = datet_end time_end = XTIMEEND
label_id = myid other_vars = crime rand.
This just produces a new dataset name interval_data, which can then be plotted. And here is the example graph that comes with the macro and its fake data (after I edited the chart slightly).
GGRAPH
  /GRAPHDATASET NAME="graphdataset" dataset = "interval_data" VARIABLES= LABELID DAY TIMEBEGIN TIMEEND MID WITHINCAT DAYWEEK
  /GRAPHSPEC SOURCE=INLINE.
BEGIN GPL
 SOURCE: s=userSource(id("graphdataset"))
 DATA: LABELID=col(source(s), name("LABELID"), unit.category())
 DATA: DAY=col(source(s), name("DAY"), unit.category())
 DATA: TIMEBEGIN=col(source(s), name("TIMEBEGIN"))
 DATA: TIMEEND=col(source(s), name("TIMEEND"))
 DATA: MID=col(source(s),name("MID"))
 DATA: WITHINCAT=col(source(s),name("WITHINCAT"), unit.category())
 DATA: DAYWEEK=col(source(s),name("DAYWEEK"), unit.category())
 COORD: rect(dim(1,2), cluster(3,0))
 SCALE: cat(dim(3), values("1","2","3","4","5","6","7","8","9","10","11","12","13","14","15","16","17","18","19","20","21","22","23",
                                         "24","25","26","27","28","29","30","31"))
 ELEMENT: interval(position(region.spread.range(WITHINCAT*(TIMEBEGIN + TIMEEND)*DAY)), color.interior(DAYWEEK),
                             transparency.interior(transparency."0.1"), transparency.exterior(transparency."1")))
 ELEMENT: point(position(WITHINCAT*MID*DAY), color.interior(DAYWEEK), label(LABELID))
END GPL.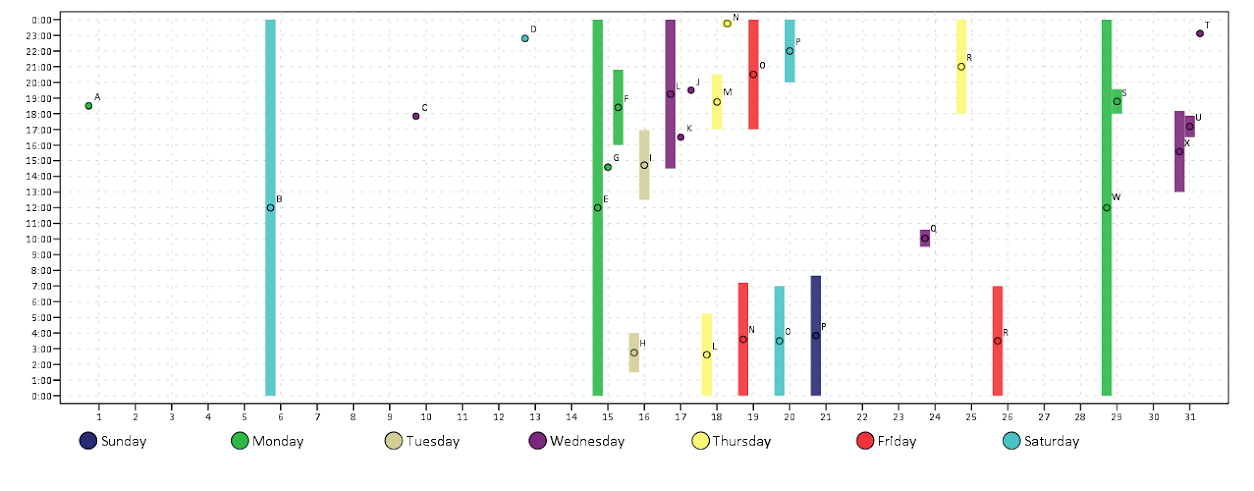
The chart can be interpreted as the days of the week are colored, and each interval represents on crime event, except when a crime events occurs over night, then the bar is split over two days (and each day the event is labeled). I wanted labels in the chart to easily reference specific events, and I assigned a point to the midpoint of the intervals to plot labels (also to give some visual girth to events that occurred over a short interval – otherwise they would be invisible in the chart). To displace the bars horizontally within the same day the chart essentially uses the same type of procedure that occurs in clustered bar charts.
GPL code can be inserted directly within macros, but it is quite a pain. It is better to use python to paramaterize GGRAPH, but I’m too lazy and don’t have python installed on my machine at work (ancient version of SPSS, V15, is to blame).
Here is another example with more of my data in the wild. This is for thefts from motor vehicles in Troy from the beginning of the year until 2/22. We had a bit of a rash over that time period, but they have since died down after the arrest of one particular prolific offender. This is evident in the chart,

We can also break down by other categories. This is what the token other_vars is for, it carries forward these other variables for use in facetting. For an example Troy has 4 police zones, and here is the graph broken down by each of them. Obviously crime sprees within short time frames are more likley perpetrated in close proximity. Also events committed by the same person are likely to re-occur within the same geographic proximity. The individual noted before was linked to events in Zone 4. I turn the labels off (it is pretty easy to toggle them in SPSS), and then one can either focus on individual events close in time or overlapping intervals pretty easily.
*Panelling by BEAT_DIST.
GGRAPH
  /GRAPHDATASET NAME="graphdataset" dataset = "interval_data" VARIABLES= LABELID DAY TIMEBEGIN TIMEEND MID WITHINCAT DAYWEEK BEAT_DIST
  /GRAPHSPEC SOURCE=INLINE.
BEGIN GPL
 SOURCE: s=userSource(id("graphdataset"))
 DATA: LABELID=col(source(s), name("LABELID"), unit.category())
 DATA: DAY=col(source(s), name("DAY"), unit.category())
 DATA: TIMEBEGIN=col(source(s), name("TIMEBEGIN"))
 DATA: TIMEEND=col(source(s), name("TIMEEND"))
 DATA: MID=col(source(s),name("MID"))
 DATA: WITHINCAT=col(source(s),name("WITHINCAT"), unit.category())
 DATA: DAYWEEK=col(source(s),name("DAYWEEK"), unit.category())
 DATA: BEAT_DIST=col(source(s),name("BEAT_DIST"), unit.category())
 COORD: rect(dim(1,2), cluster(3,0))
 SCALE: cat(dim(3), values("1","2","3","4","5","6","7","8","9","10","11","12","13","14","15","16","17","18","19","20","21","22","23",
                           "24","25","26","27","28","29","30","31","32","33","34","35","36","37","38","39","40","41","42","43","44","45",
                           "46"))
 ELEMENT: interval(position(region.spread.range(WITHINCAT*(TIMEBEGIN + TIMEEND)*DAY*1*BEAT_DIST)), color.interior(DAYWEEK),
                             transparency.interior(transparency."0.1"), transparency.exterior(transparency."1")))
 ELEMENT: point(position(WITHINCAT*MID*DAY*1*BEAT_DIST), color.interior(DAYWEEK), label(LABELID))
END GPL.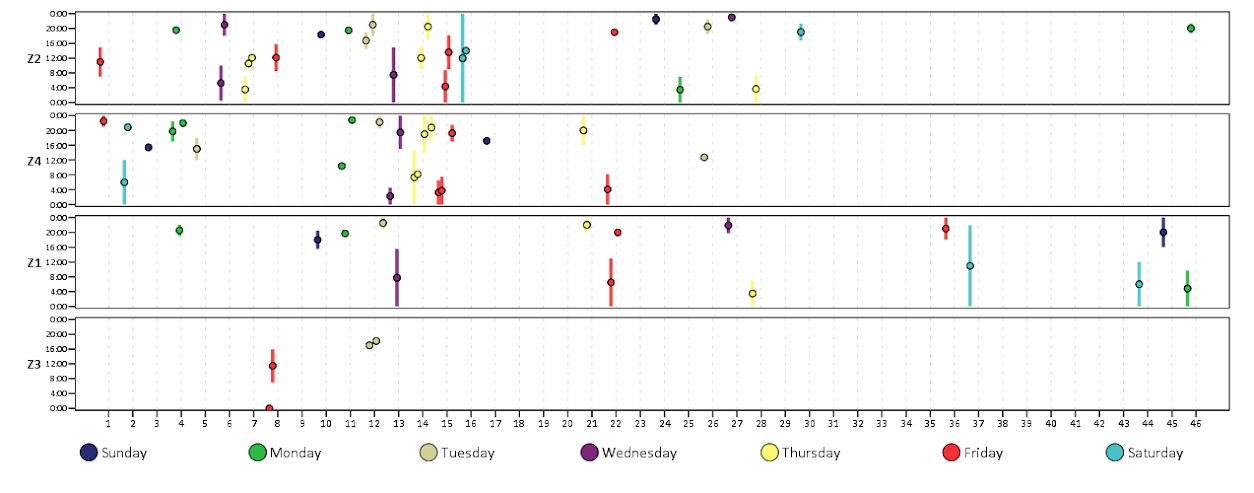
Note that to make the X axis insert all of the days I needed to include all of the numerical categories (between 1 and 46) in the value statement in the SCALE statement.
The chart in its current form can potentially be improved in a few ways, but I’ve had trouble accomplishing them so far. One is instead of utilizing clustering to displace the intervals, one could use dodging directly. I have yet to figure out how to specify the appropriate GPL code though when using dodging instead of clustering. Another is to utilize the dates directly, instead of any aribitrary categorical counter since the beginning of the series. To use dodging or clustering the axis needs to be categorical, so you could just make the axis the date, but bin the dates and specify the width of the bin categories to be 1 day (this would also avoid the annoying values statement to specify all the days). Again though, I was not able to figure out the correct GPL code to accomplish this.
I’d like to investigate ways to make this interactive and link with maps as well. I suspect it is possible in D3.js, and if I get around to figuring out how to make such a map/graphic duo I will for sure post it on the blog. In the meantime any thoughts or comments are always appreciated.


2 Comments