There have been several recent high profile cases of plagiarism in the news recently. Chris Rufo, a conservative pundit, has identified plagiarism in Claudine Gay and Christina Cross’s work. In a bit of tit-for-tat, Neri Oxman was then profiled for similar sins (as her husband was one of the most vocal critics of Gay).
Much of the discussion around this seems to be more focused on who is doing the complaining than the actual content of the complaints. It can simultaneously be true that Chris Rufo has ulterior motives to malign those particular scholars (ditto for those criticizing Neri Oxman), but the complaints are themselves legitimate.
What is plagiarism? I would typically quote a specific definition here, but I actually do not like the version in the Merriam Webster (or American Heritage) dictionary. I assert plagiarism is the direct copying of material without proper attribution to its original source. The concept of “idea” plagiarism seems to muddy up the waters – I am ignoring that here. That is, even if you don’t “idea” plagiarize, you can do “direct copying of material without proper attribution”.
It may seem weird that you can do one without the other, but many of the examples given (whether by Rufo or those who pointed out Neri Oxman’s) are insipid passages that are mostly immaterial to the main thesis of the paper, or they have some form of attribution but it is not proper. So it goes, the way academics write you can cut out whole cloth large portions of writing and it won’t make a difference to the story line.
These passages however are clearly direct copying of material without proper attribution. I think Cross’s is a great example, here is one (of several Rufo points out):

Words are so varied, if I gave you a table of descriptions, something like:
survey years: 1998, 2000, ...., 2012
missing data: took prior years survey values
And asked 100 scholars to put that in a plain text description in a paragraph, all 100 would have some overlap in wording, but not near this extent. For numbers, these paragraphs have around 30 words, say your word vocabulary relevant to describe that passage is 100 words, the overlap would be under 10% of the material. Here is a simple simulation to illustrate.

And this does not consider the word order (and the fact that the corpus is much larger than 100 words). Which will both make the probability of this severe of overlap much smaller.
Unlike what ASA says, it does not matter that what was copied is a straightforward description of a dataset, it clearly still is plagiarism in terms of “direct copying without proper attribution”. The Neri Oxman examples are similar, they are direct copying, even if they have an in text citation at the end, that is not proper attribution. If these cases went in front of ethics boards at universities that students are subject to, they would all be found guilty of plagiarism. The content of what was copied and its importance to the work does not matter at all.
So the defense of the clearly indefensible based on ideological grounds among academics I find quite disappointing. But, as a criminologist I am curious as to its prevalence – if you took a sample of dissertations or peer reviewed articles, how many would have plagiarized passages? Would it be 1%, or 10%, or 50%, I genuinely do not know (it clearly won’t be 0% though!).
I would do this to my own articles if I could easily (I don’t think I did, but it is possible I self-plagiarized portions of my dissertation in later peer reviewed articles). So let me know if you have Turnitin (or are aware of another service), that can upload PDFs to check this.
I’d note here that some of the defense of these scholars is the “idea” part of plagiarism, which is a shifting sands definition of saying it is necessary to steal some fundamental idea for it to be plagiarism. Idea plagiarism isn’t really a thing, at least not a thing anymore than vague norms among academics (or even journalists). Scooping ideas is poor form, but that is it.
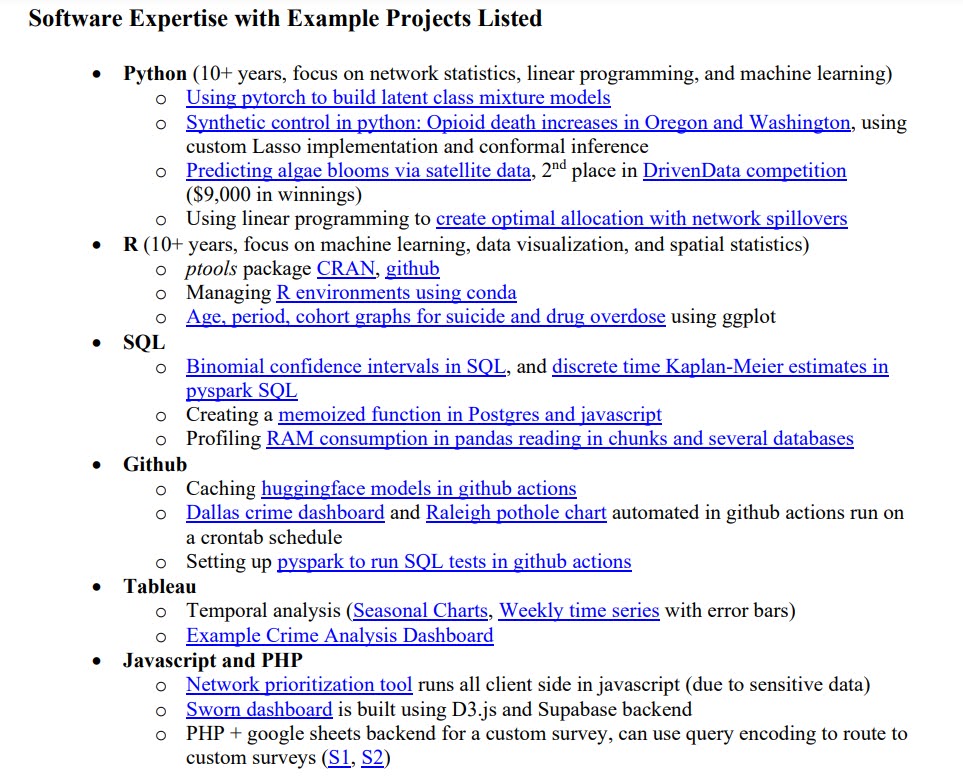
I am not aware of my words being plagiarized, I am aware of several examples of scholars clearly taking work from my code repositories or blog posts and not citing them. (As a note to scholars, it is fine to cite my blog posts, I maybe have a dozen or so citations to my blog at this point.) But those would not typically be considered plagiarism. If someone copies one of my functions and applies it to their own data, it is not plagiarism as typically understood. If I noted that and sent those examples to COPE and asked for the articles to be retracted, I am pretty sure COPE would say that is not plagiarism as typically treated.
Honestly it does not matter though. I find it obnoxious to not be cited, but it is a minor thing, and clearly does not impact the quality of the work. I basically expect my work on the blog to be MIT licensed (subject to change) – it is mostly a waste of time for me to police how it is used. Should Cross be disciplined for her plagiarism? Probably not – if it was an article I would suggest a correction would be sufficient.
I can understand students may be upset that they are held to higher standards than their professors, but I am not sure if that means students should be given more slack or if professors should be given less. These instances of plagiarism by Gay/Cross/Oxman I take more as laziness than anything, but they do not have much to do with whether they are fit for their jobs.
AI writing
Pretty soon, even my plagiarism definition is not going to work anymore, as generative chatbots are essentially stochastic parrots – everything they do is paraphrasing plagiarism, but in a form that is hard to see direct copying (that tools like Turnitin will identify). So I am starting to get links to the blog from Perplexity and Iask. So people may cite ChatGPT or whatever service generated the text, but that service copied from someone else, and no one is the wiser.
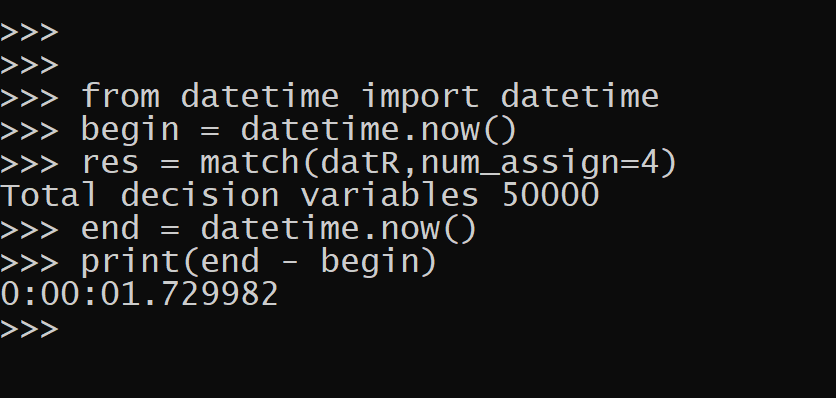
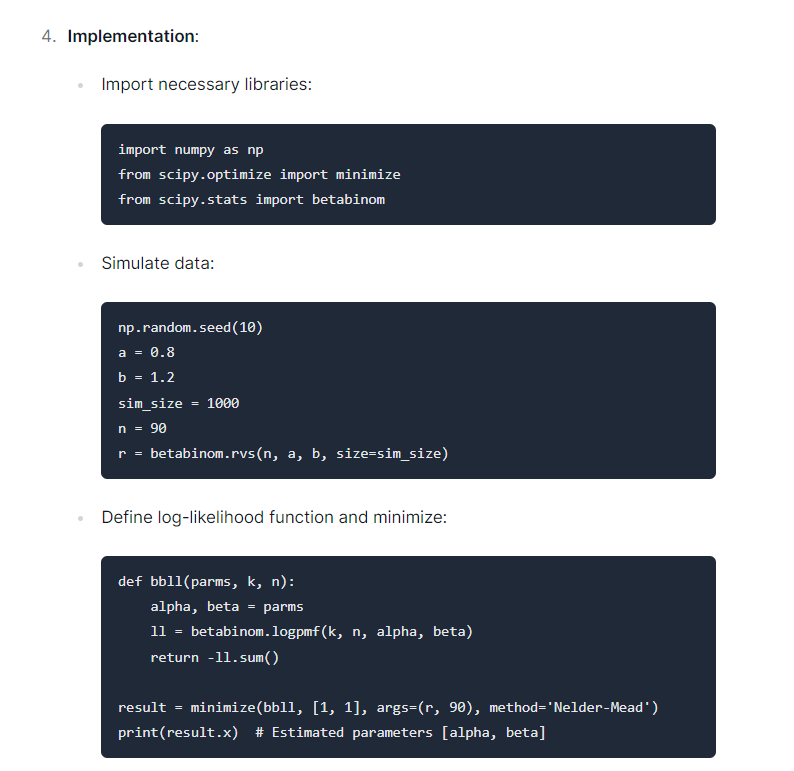
These specific services have paraphrasing citations, e.g. you ask a question, it gives the response + 3 citations (these are called RAG applications in LLM speak). So you may think they are OK in terms of above, they give paraphrasing type at the end of paragraph citations. But I have noticed they frequently spit out near verbatim copies of my work for a few blog posts I get traffic for. The example I have linked to was this post on fitting a beta-binomial model in python. So I intentionally wrote that post because the first google results were bad/wrong and ditto for the top stackoverflow questions. So I am actually happy my blog got picked up by google quite fast and made it to the top of the list.
These services are stochastic, so subject to change, but iask is currently a direct copy of my work and does not give me as a list of its citations (although I come up high in their search rankings, so not clear to me why I am not credited). Even if it did though it would be the same problem as Oxman, it would not be a proper quoted citation.
And the Cross faux pas edit a few words will not only be common but regular with these tools.
This is pretty much intended though from my perspective with these tools – I saw a wrong on the internet and wrote a post to make it so others do not make the same mistakes. Does it matter if the machine does not properly attribute me? I just want you to do your stats right, I don’t get a commission if you properly cite me. (I rather you just personally hire me to help than get a citation!)
I think these services may make citation policing over plagiarism impossible though. No major insights here to prevent it – I say now it is mostly immaterial to the quality of the work, but I do think saying you can carte blanche plagiarize is probably not good.