
A recent paper with Gio Circo, Trauma Center Drive Time Distances and Fatal Outcomes among Gunshot Wound Victims, was published in Applied Spatial Analysis and Policy. In this work, me and Gio estimate the marginal effect that drive time distances to the nearest Level 1 trauma center have on the probability a victim dies of a gun shot wound, using open Philadelphia data.
If you do not have access to that published version, here is a pre-print version. (And you can always email me or Gio and ask for a copy.) Also because we use open data, we have posted the data and code used for the analysis. (Gio did most of the work!)
For a bit of the background on the project, Gio had another paper estimating a similar model using Detroit data. But Gio estimated those models with aggregate data. I was familiar with more detailed Philly shooting data, as I used it for an example hot spot cluster map in my GIS crime mapping class.
There are two benefits to leveraging micro data instead of the aggregated data. One is that you can incorporate micro level incident characteristics into the model. The other is that you can get the exact XY coordinates where the incident occurred. And using those exact coordinates we calculate drive time distances to the hospital, which offer a slight benefit in terms of leave-one-out cross-validated accuracy compared to Euclidean distances.
So in terms of incident level characteristics, the biggest factor in determining your probability of death is not the distance to the nearest hospital, but where you physically get shot on your body. Here is a marginal effect plot from our models, showing how the joint effect of injury location (as different colors) and the drive time distance impact the probability of death. So if you get shot in the head vs the torso, you have around a 30% jump in the probability of death from that gun shot wound. Or if you get shot in an extremity you have a very low probability of death as well.
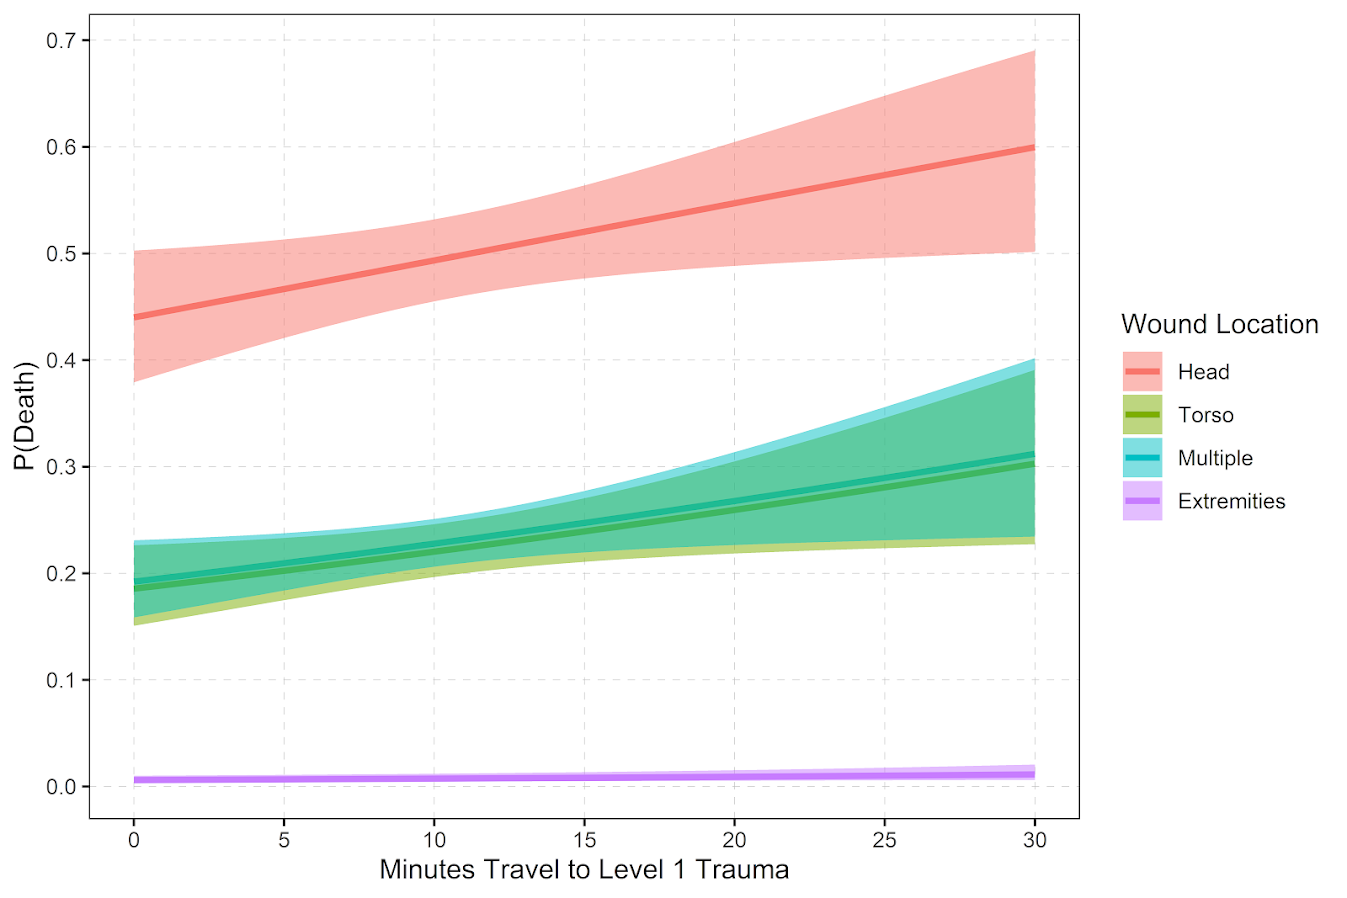
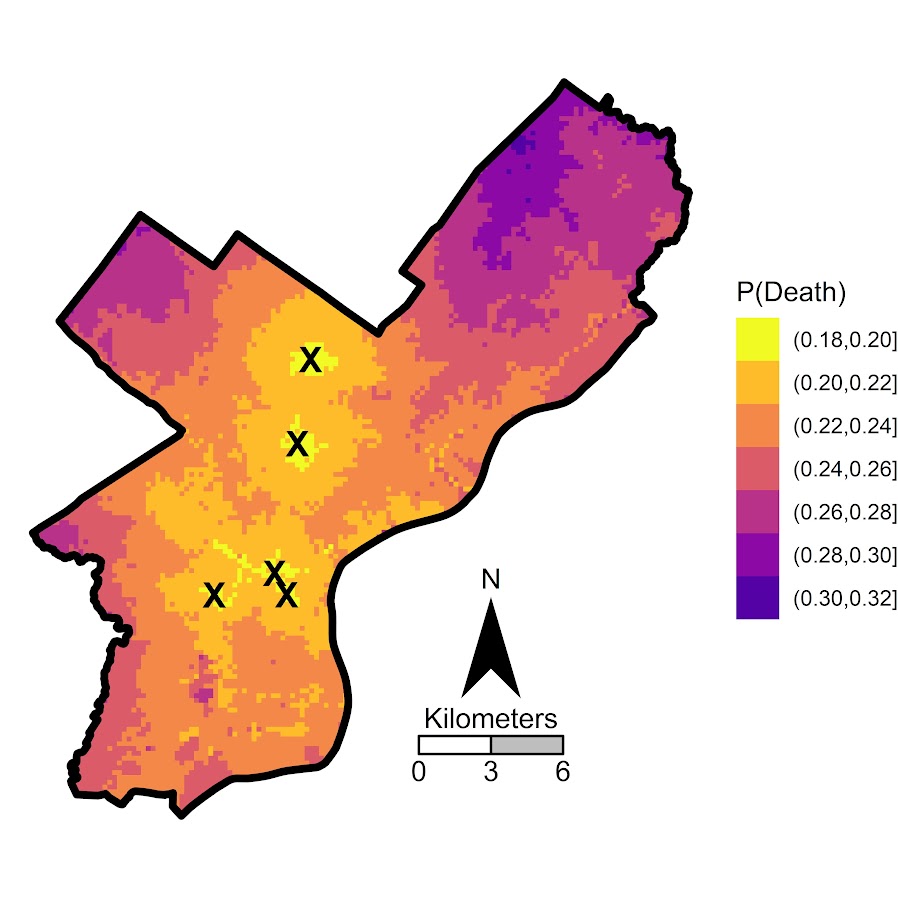
But you can see from that the margins for drive times are not negligible. So if you are nearby a hospital and shot in the torso your probability of dying is around 20%, whereas if you are 30 minutes away your probability rises to around 30%. You can then use this to map out isochrone type survivability estimates over the city. This example map is if you get shot in the torso, and the probability of death based on the drive time distance to the nearest Level 1 trauma location.
Fortunately many shootings do not occur in the northern most parts of Philadelphia, here is a map of the number of shootings over the city for our sample.
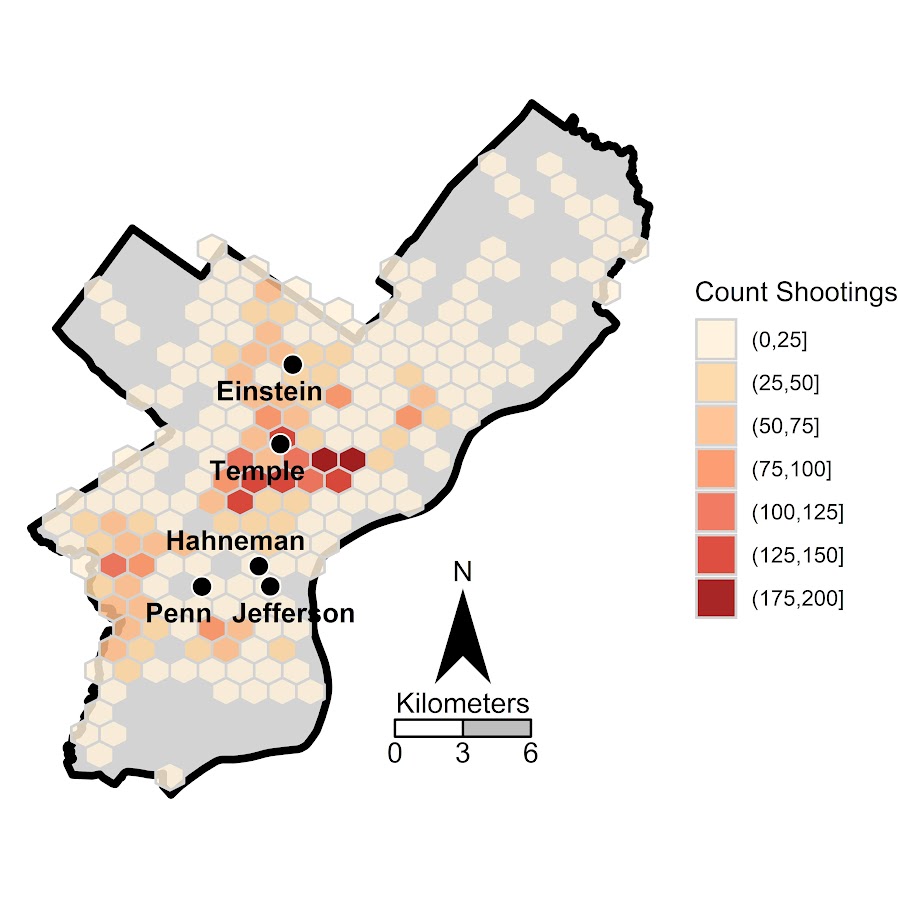
You can subsequently use these models to either do hypothetical take a trauma center away or add a trauma center. So given the density of shootings and drive time distances, it might make sense for Philly to invest in a trauma center in the shooting hot spot in the Kensington area (northeast of Temple). (You could technically figure out an ‘optimal’ location given the distribution of shootings, but since you can’t just plop down a hospital wherever it would make more sense to do hypothetical investments in current hospitals.)
For a simplified example, imagine you had 100 shootings in the torso that were an average 20 minutes away. The average probability of death in that case is around 25% (so ~25 homicides). If you hypothetically have a location that is only 5 minutes away, the probability goes down to more like 20% (so ~20 homicides). So in that hypothetical, the distance margin would have prevented 5 deaths.
One future piece of research I would be interested in examining is pre-post Shotspotter. So in that article Jen Doleac is right in that the emipirical evidence for Shotspotter reducing shootings is pretty flimsy, but preventing mortality by getting to the scene faster may be one mechanism that ShotSpotter can justify its cost.


1 Comment