
So I have two prior examples of weighting the WDD test (a simple test for pre-post crime counts in an experimental setting):
And a friend recently asked about weighting for different areas, so the test is crime reduction per area density instead of overall counts. First before I get into the example, this isn’t per se necessary. All that matters in the end for this test to be valid is 1) the crime data are Poisson distributed, 2) the control areas follow parallel trends to the treated area. So based on this I’ve advocated that it is ok to have a control area be ‘the rest of the city’ for example.
Some of my work on long term crime trends at micro places, shows low-crime and high-crime areas all tend to follow the same overall temporal trends (and Martin Andresen’s related work one would come to the same conclusion). So that would suggest you can aggregate up many low crimes to make a reasonable control comparison to a hot spot treated area.
So as I will show weighting by area is possible, but it actually changes the identification strategy slightly (whereas the prior two weighting examples do not) – the parallel trends assumption needs to be on the crime per area estimate, as opposed to the original count scale. Since the friend who asked about this is an Excel GURU (check out Grant’s very nice YouTube videos for crime analysis) I will show how to do the calculations in Excel, as well as how to do a simulation to show my estimator behaves as it should. (And the benefit of that is you can do power analysis based on the simulations.)
Example Calculations in Excel
I have posted an Excel spreadsheet to show the calculations here. But for a quick overview, I made the spreadsheet very similar to the original WDD calculation, you just need to insert your areas for the different treated/control/displacement areas.
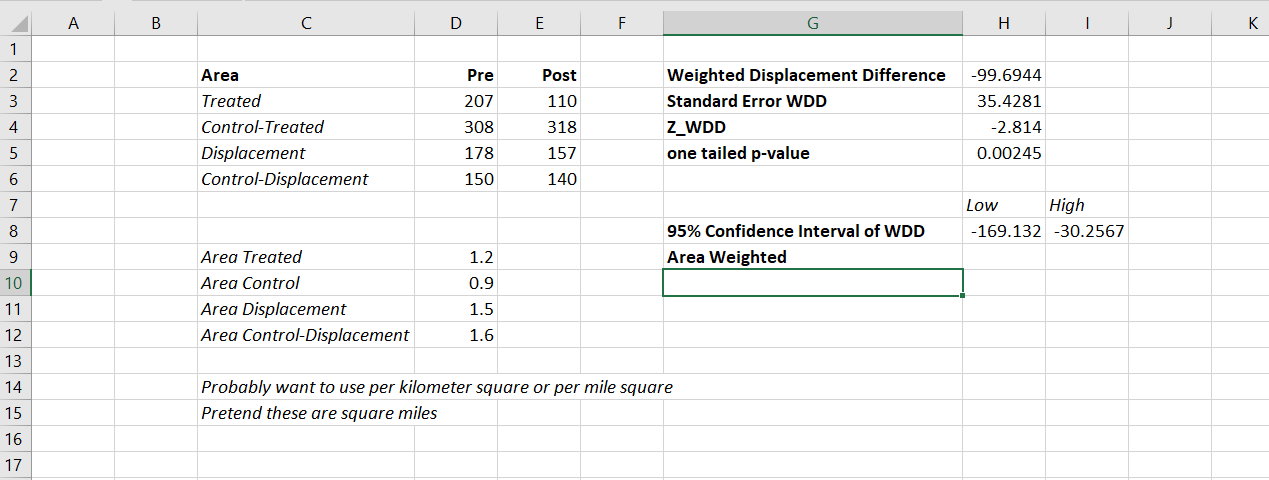
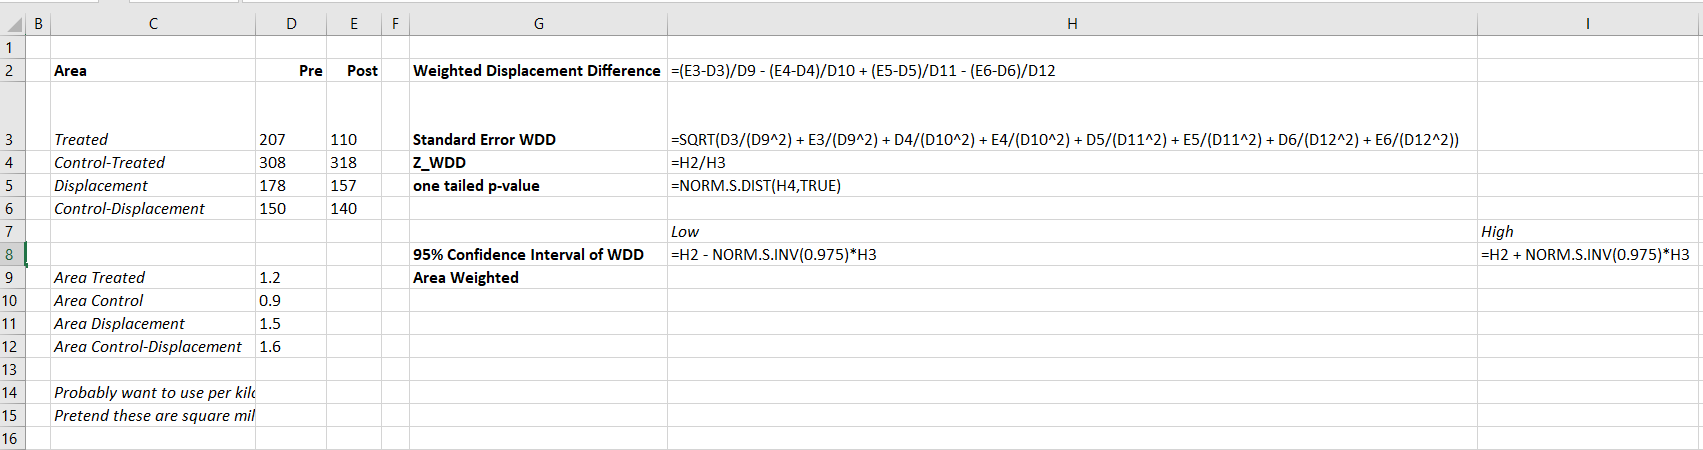
And you can check out the formulas, again it is just weighting the estimator by the areas, and then making the appropriate transformations to the variance estimates.
I have an added extra portion of this though – a simulation tab to show the estimator works.
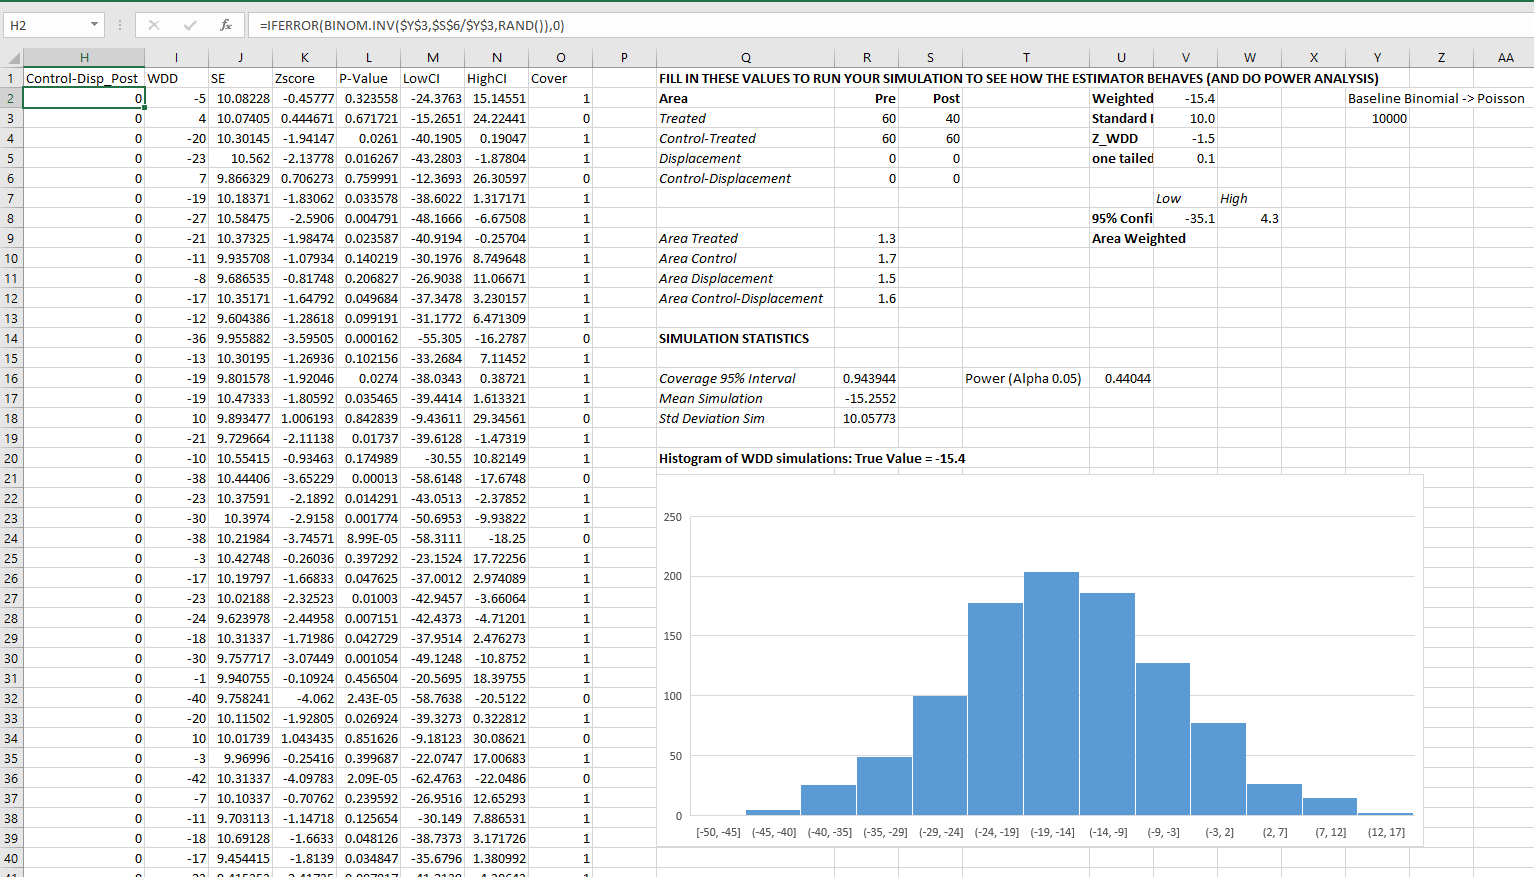
Only thing to note, a way to simulate to Poisson data in Excel is to generate a random number on the unit interval (0,1), and then for the distribution of interest use the inverse CDF function. There is no inverse Poisson function in Excel, but you can reasonably approximate it via the inverse binomial with a very large number of trials. I’ve tested and it is good enough for my purposes to use a base of 10k for the binomial trials.
The simulation tab on this spreadsheet you can input your own numbers for planning purposes as well. So the idea is if you think you can only reasonably reduce crimes by X amount in your targeted areas, this lets you do power analysis. So in this example, going from 60 to 40 crimes results in a power estimate of only 0.44 (so you will fail to reject the null over 5 out of 10 times, even if your intervention actually works as well as you think). But if you think you can reduce crimes from 60 to 30, the power in this example gets close to 0.8 (what you typically shoot for in up-front experiments, although there is no harm for going for higher power!). So if you have low power you may want to expand the time periods under study or expand the number of treated areas.
Wrap Up
Between this and the prior WDD examples, I have about wrapped up all the potential permutations of weighting I can think of offhand. So you can mix/match all of these different weighting strategies together (e.g. you could do multiple time periods and area weighting). It is just algebra and carrying through the correct changes to the variance estimates.
I do have one additional blog post slated in the future. David Wilson has a recent JQC article using a different estimate, but essentially the same pre/post data I am using here. The identifying assumptions are different again for this (parallel trends on the ratio scale, not the linear scale), and I will have more to say when I think you would prefer the WDD to David’s estimator. (In short I think David’s is good for meta-analysis, but I prefer my WDD for individual evaluations.)


4 Comments