Hot spots of crime in Raleigh and home buying

So my realtor, Ellen Pitts (who is highly recommended, helped us a ton remotely moving into Raleigh), has a YouTube channel where she talks about real estate trends. Her most recent video she discussed a bit about crime in Raleigh relative to other cities because of the most recent shooting.

My criminologist hot take is that generally most cities in the US are relatively low crime. So Ellen shows Dallas has quite a few more per-capita shootings than Raleigh, but Dallas is quite safe “overall”. Probably somewhat contra to what most people think, the cities that in my opinion really have the most crime problems tend to be smaller rust belt cities. I love Troy, NY (where I was a crime analyst for a few years), but Troy is quite a bit rougher around the edges than Raleigh or Dallas.

So this post is more about, you have already chosen to move to Raleigh – if I am comparing house 1 and house 2 (or looking at general neighborhoods), do I need to worry about crime in this specific location?

So for a few specific resources/strategies for the home hunter. Not just in Raleigh, but many cities now have an open data portal. You can often look at crime. Here is an example with the Raleigh open data:

So if you have a specific address in mind, you can go and see the recent crime around that location (cities often fuzz the address a bit, so the actual points are just nearby on that block of the street). Blue dots in that screenshot are recent crimes in 2022 against people (you can click on each dot and get a more specific breakdown). Be prepared when you do this – crime is everywhere. But that said the vast majority of minor crime incidents should not deter you from buying a house or renting at a particular location.

Note I recommend looking at actual crime data (points on a map) for this. Several vendors release crime stats aggregated to neighborhoods or zipcodes, but these are of very low quality. (Often they “make up” data when it doesn’t exist, and when data does exist they don’t have a real great way to rank areas of low or high crime.)

For the more high level, should I worry about this neighborhood, I made an interactive hotspot map.

For the methodology, I focused on crimes that I would personally be concerned with as a homeowner. If I pull larceny crimes, I am sure the Target in North Hills would be a hotspot (but I would totally buy a condo in North Hills). So this pulls the recent crime data from Raleigh open data starting in 2020, but scoops up aggravated assaults, interpersonal robberies, weapon violations, and residential burglaries. Folks may be concerned about drug incidents and breaking into cars as well, but my experience those also do not tend to be in residential areas. The python code to replicate the map is here.

Then I created DBScan clusters that had at least 34 crimes – so these areas average at least one of these crimes per month over the time period I sampled. Zooming in, even though I tried to filter for more potentially residential related crimes, you can see the majority of these hot spots of crime are commercial areas in Raleigh. So for example you can zoom in and check out the string of hot spots on Capital Blvd (and if you click a hot spot you can get breakdowns of specific crime stats I looked at):

Very few of these hot spots are in residential neighborhoods – most are in more commercial areas. So when considering looking at homes in Raleigh, there are very few spots I would worry about crime at all in the city when making a housing choice. If moving into a neighborhood with a higher proportion of renters I think is potentially more important long term signal than crime here in Raleigh.

A new series: The Criminal Justician

In partnership with the American Society of Evidence Based Policing (ASEBP), I have started a new blog series on their website, The Criminal Justician. The first post is up, Denver’s STAR Program and Disorder Crime Reductions, which you can read if you have a membership.

ASEBP is an organization that brings together in the field police officers, as well as researchers, policy makers, and community leaders to promote scientific progress in the policing profession. For officers, analysts, and police researchers wanting to make a difference, it is definately an organization worth joining and participating in the trainings/conferences.

The blog series will be me discussing recent scientific research of relevance to policing. I break down complicated empirical results to be more accessible to a wider audience – either to understand the implications for the field or to critique the potential findings. If before you want to pony up the few dollars for joining ASEBP, here are some examples of past articles on my personal blog of similar scope:

I will still blog here about more technical things, like optimizing functions/statistical coding. But my more opinion pieces on current policing research will probably head over to the ASEBP blog series. In the hopper are topics like police scorecards, racial bias in predictive policing, and early intervention systems (with plans to post an article around once a month).

Hyperparameter tuning for Random Forests

Motivated to write this post based on a few different examples at work. One, we have periodically tried different auto machine learning (automl) libraries at work (with quite mediocre success). They are OK for a baseline, not so much for production. Two, a fellow data scientist was trying some simple hyperparameter search in random forests, and was searching over all the wrong things.

For those not familiar, automl libraries, such as data robot or databricks automl, typically do a grid search over different models given a particular problem (e.g. random forest, logistic regression, XGBoost, etc.). And within this you can have variants of similar models, e.g. RFMod1(max-depth=5) vs RFMod2(max-depth=10). Then given a train/test split, see which model wins in the test set, and then suggests promoting that model into production.

My experience at work with these different libraries (mostly tabular medical records data), they choose XGBoost variants at a very high frequency. I think this is partially due to poor defaults for the hyperparameter search in several of these automl libraries. Here I will just be focused on random forests, and to follow along I have code posted on Github.

Here I am using the NIJ recidivism challenge data I have written about in the past, and for just some upfront work I am loading in various libraries/functions (I have the recid functions in the githup repo). And then making it easy to just load in the train/test data (with some smart feature engineering already completed).

from datetime import datetime
import matplotlib.pyplot as plt
import numpy as np
import optuna
import pandas as pd
from sklearn.metrics import brier_score_loss, roc_auc_score
from sklearn.model_selection import train_test_split
from sklearn.ensemble import RandomForestClassifier
import recid # my custom NIJ recid funcs

# Read in data and feature engineering
train, test = recid.fe()

Now first, in terms of hyperparameter tuning you need to understand the nature of the model you are fitting, and how those hyperparameters interact with the model. In terms of random forests for example, I see several automl libraries (and my colleague) doing a search over the number of trees (or estimators in sklearn parlance). Random forests the trees are independent, and so having more trees is always better. It is sort of like saying would you rather me do 100 simulations or 1,000,000 simulations to estimate a parameter – the 1,000,000 will of course have a more accurate estimate (although may be wasteful, as the extra precision is not needed).

So here, using the NIJ defined train/test split, and a set of different fixed parameters (close to what I typically default to for random forests). I show how AUC or the Brier Score changes with the number of trees, over a grid from 10 to 1000 trees:

# Loop over tree sizes
ntrees = np.arange(10,1010,10)
auc, bs = [], []

# This is showing number of estimators is asymptotic
# should approach best value with higher numbers
# but has some variance in out of sample test
for n in ntrees:
    print(f'Fitting Model for ntrees:{n} @ {datetime.now()}')
    # Baseline model
    mod = RandomForestClassifier(n_estimators=n, max_depth=5, min_samples_split=50)
    # Fit Model
    mod.fit(train[recid.xvars], train[recid.y1])
    # Evaluate AUC/BrierScore out of sample
    pred_out = mod.predict_proba(test[recid.xvars])[:,1]
    auc.append(roc_auc_score(test[recid.y1], pred_out))
    bs.append(brier_score_loss(test[recid.y1], pred_out))

# Making a plot of the 
fig, (ax1, ax2) = plt.subplots(2, figsize=(6,8))
ax1.plot(ntrees, auc)
ax1.set_title('AUC')
ax2.plot(ntrees, bs)
ax2.set_title('Brier Score')
plt.savefig('Ntree_grid.png', dpi=500, bbox_inches='tight')

We can see that the relationship is noisy, but the trend clearly decreases with tree size, and perhaps asymptotes post 200 some trees for both metrics in this particular set of data.

So of course it depends on the dataset, but when I see automl libraries choosing trees in the range of 10, 50, 100 for random forests I roll my eyes a bit. You always get more accurate (in a statistical sense), with more trees. You would only choose that few for convenience in fitting and time savings. The R library ranger has a better default of 500 trees IMO (sklearns 100 is often too small in doing tests). But there isn’t much point in trying to hyperparameter tune this – your hyperparameter library may choose a smaller number of trees in a particular run, but this is due to noise in the tuning process itself.

So what metrics do matter for random forests? All machine learning models you need to worry about over-fitting/under-fitting. This depends on the nature of the data (number of rows, can fit more parameters, fewer columns less of opportunity to overfit). Random forests this is dependent on the complexity of the trees – more complex trees can overfit the data. If you have more rows of data, you can fit more complex trees. So typically I am doing searches over (in sklearn parlance) max-depth (how deep a tree can grow), min-samples-split (can grow no more trees is samples are too tiny in a leaf node). Another parameter to search for is how many columns to subsample as well (more columns can find more complex trees).

It can potentially be a balancing act – if you have more samples per leaf, it by default will create less complex trees. Many of the other hyperparameters limiting the complexity of the trees are redundant with these as well (so you could really swap out with max-depth). Here is an example of using the Optuna library a friend recommended to figure out the best parameters for this particular data set, using a train/eval approach (so this splits up the training set even further):

# Consistent train/test split for all evaluations
tr1, tr2 = train_test_split(train, test_size=2000)

def objective(trial):
    param = {
        "n_estimators": 500,
        "max_depth": trial.suggest_int("max_depth", 2, 10),
        "min_samples_split": trial.suggest_int("min_samples_split", 10, 200, step=10),
        "max_features": trial.suggest_int("max_features", 3, 15),
    }
    mod = RandomForestClassifier(**param)
    mod.fit(tr1[recid.xvars], tr1[recid.y1])
    pred_out = mod.predict_proba(tr2[recid.xvars])[:,1]
    auc = roc_auc_score(tr2[recid.y1], pred_out)
    return auc

study = optuna.create_study(direction="maximize")
study.optimize(objective, n_trials=100)
trial = study.best_trial

print(f"Best AUC {trial.value}")
print("Best Params")
print(trial.params)

So here it chooses fairly deep trees, 9, but limited complexity via the sample size in a leaf (90). The number of features per tree is alsio slightly larger than default (here 25 features, so default is sqrt(25)). So it appears my personal defaults were slightly under-fitting the data.

My experience regression prefers smaller depth of trees but lower sample sizes (splitting to 1 is OK), but for binary classification limiting sample sizes in trees is preferable.

One thing to pay attention to in these automl libraries, a few do not retrain on the full dataset with the selected hyperparameters. For certain scenarios you don’t want to do this (e.g. if using the eval set to do calibrations/prediction intervals), but if you don’t care about those then you typically want to retrain on the full set. Another random personal observation, random forests really only start to outperform simpler regression strategies at 20k cases, with smaller sample sizes and further splitting train/eval/test, the hyperparameter search is very noisy and mostly a waste of time. If you only have a few hundred cases just fit a reasonable regression model and call it a day.

So here I retrain on the full test set, and then look at the AUC/Brier Score compared to my default model.

# Lets refit according to these params for the full
# training set
mod2 = RandomForestClassifier(n_estimators=500,**trial.params)
mod2.fit(train[recid.xvars], train[recid.y1])
pred_out = mod2.predict_proba(test[recid.xvars])[:,1]
auc_tuned = roc_auc_score(test[recid.y1], pred_out)
bs_tuned = brier_score_loss(test[recid.y1], pred_out)
print(f"AUC tuned {auc_tuned:.4f} vs AUC default {auc[-1]:.4f}")
print(f"Brier Score tuned {bs_tuned:.4f} vs default {bs[-1]:.4f}")

It is definately worth hyperparameter tuning once you have your feature set down, but lift of ~0.01 AUC (which is typical for hypertuned tabular models in my experience) is not a big deal with initial model building. Figuring out a smart way to encode some relevant feature (based on domain knowledge of the problem you are dealing with) typically has more lift than this in my experience.

Surpassed 100k views in 2022

For the first time, yearly view counts have surpassed 100,000 for my blog.

I typically get a bump of (at best) a few hundred views when I first post a blog. But the most popular posts are all old ones, and I get the majority of my traffic via google searches.

Around March this year monthly bumped up from around 9k to 11k views per month. Not sure of the reason (it is unlikely due to any specific inidividual post, as you can see, none of the most popular posts were posted this year). A significant number of the views are likely bots (what percent overall though I have no clue). So it is possible my blog was scooped up in some other aggregators/scrapers around that time (I would think those would not be counted as search engine referrals though).

One interesting source for the blog, when doing academic style posts with citations, my blog gets picked up by google scholar (see here for example). It is not a big source, but likely a more academic type crowd being referred to the blog (I can tell people have google scholar alerts – when scholar indexes a post I get a handful of referrals).

I have some news coming soon about writing a more regular criminal justice column for an organization (readers will have to wait alittle over a week). But I also do Ask Me Anything, so always feel free to send me an email or comment on here (started AMA as I get a trickle of tech questions via email anyway, and might as well share my response with everyone).

I typically just blog generally about things I am working on. So maybe next up is that auto-ml libraries often have terrible defaults for hypertuning random forests, or maybe an example of data envelopment analysis, or quantile regression for analyzing response times, or monitoring censored data are all random things I have been thinking about recently. But no guarantees about any those topics in particular!

Outputs vs Outcomes and Agile

For my criminal justice followers, there is a project planning strategy, Agile, that dominates software engineering. The idea behind Agile is to formulate plans in short sprints (we do two week sprints at my work). So we have very broad based objectives (Epics) that can span a significant amount of time. Then we have shorter goals (Stories) that are intended to take up the sprint. Within each story, we further break down our work into specific tasks that we can estimate how long they will take. So something at my work may look like:

  • Build Model to Predict Readmission for Heart Attacks (Epic)
    • Create date pipeline for training data (Story)
      • SQL functions to prepare data (Task, 2 days)
      • python code to paramaterize SQL (Task, 3 days)
      • Unit tests for python code (Task, 1 day)
    • Build ML Model (Story)
      • evaluate different prediction models (Task, 2 days)
    • Deploy ML Model in production (Story)

Etc. People at this point often compare Agile vs Waterfall, where waterfall is more longish term planning (often on say a quarterly schedule). And Agile per its name is suppossed to be more flexible, and modify plans on short term. Most of my problems with Agile could apply though to Waterfall planning as well – short term project planning (almost by its nature) has to be almost solely focused on outputs and not outcomes.

Folks with a CJ background will know what I am talking about here. So police management systems often contrast focusing on easily quantifiable outputs, such as racking up traffic tickets and low level arrests, vs achieving real outcomes, such as increased traffic safety or reducing violent crime. While telling police officers to never do these things does not make sense, you can give feedback/nudge them to engage in higher quality short term outputs that should better promote those longer term outcomes you want.

Agile boards (where we post these Epics/Stories/Tasks, for people to keep tabs on what everyone is doing) are just littered with outputs that have little to no tangible connection to real life outcomes. Take my Heart Attack example. It may be there is a current Heart Attack prediction system in place based on a simple scorecard – utility in that case would be me comparing how much better my system is than the simpler scorecard method. If we are evaluating via dollars and cents, it may only make sense to evaluate how effective my system is in promoting better health outcomes (e.g. evaluating how well my predictive system reduces follow up heart attacks or some other measure of health outcomes).

The former example is not a unit of time (and so counts for nothing in the Agile framework). Although in reality it should be the first thing you do (and drop the project if you cannot sufficiently beat a simple baseline). You don’t get brownie points for failing fast in this framework though. In fact you look bad, as you did not deliver on a particular product.

The latter example unfortunately cannot be done in a short time period – we are often talking about timescales of years at that point instead of weeks. People can look uber productive on their Agile board, and can easily accomplish nothing of value over broad periods of time.

Writing this post as we are going through our yearly crisis of “we don’t do Agile right” at my workplace. There are other more daily struggles with Agile – who defines what counts as meeting an objective? Are we being sufficiently specific in our task documentation? Are people over/under worked on different parts of the team? Are we estimating the time it takes to do certain tasks accurately? Does our estimate include actual work, or folds in uncertainty due to things other teams are responsible for?

These short term crises of “we aren’t doing Agile right” totally miss the boat for me though. I formulate my work strategy by defining end goals, and then work backwards to plan the incremental outputs necessary to achieve those end goals. The incremental outputs are a means to that end goal, not the ends themselves. I don’t really care if you don’t fill out your short term tasks or mis-estimate something to take a week instead of a day – I (and the business) cares about the value added of the software/models you are building. It isn’t clear to me that looking good on your Agile board helps accomplish that.

Column storage for wide datasets

The notion of big data is quite a bit overhyped. I do get some exposure to it at work, but many tools like Hadoop are not needed over doing things in chunks on more typical machines. One thing though I have learned more generally about databases, many relational databases (such as postgres) store data under the hood like this:

Index1|1|'a'|Index2|2|'b'.....|Index9999|1|'z'

So they are stacked cumulatively in an underlying file format. And then to access the information the system has to know “ok I need to find Index2 and column 2”, so it calculates offsets for where those pieces of information should be located in the file.

This however is not so nice for databases that have many columns. In particular administrative record databases that have few rows, but many thousands of columns (often with many missing fields and low dimensional categories), this default format is not very friendly. In fact many databases have limits on the number of columns a table can have. (“Few rows” is relative, but really I am contrasting with sensor data that often has billions/trillions of rows, but very few columns.)

In these situations, a columnar database (or data format) makes more sense. Instead of having to calculate many large number of offsets, the database often will represent the key-column pairs in some easier base format, and then will only worry about grabbing specific columns. Both representing the underlying data in a more efficient manner will lower on computer disk space (e.g. only takes up 1 gig instead of many gigabytes) as well as improve input/output operations on the data (e.g. it is faster to read the data/write new data).

I will show some examples via the American Community Survey data for micro areas. I have saved the functions/code here on github to follow along.

So first, I load in pandas and DuckDB. DuckDB is an open source database that uses by default a columnar storage format, but can consider it a very similar drop in replacement for sqllite for persistantly storing data.

import pandas as pd
import duckdb
import os

# my local census functions
# grabbing small area 2019 data
# here defaults to just Texas/Delaware
# still takes a few minutes
import census_funcs
cen2019_small, fields2019 = census_funcs.get_data(year=2019)
print(cen2019_small.shape) # (21868, 17145)

Here I grab the small area data for just Texas/Delaware (this includes mostly census tracts and census block groups in the census FTP data). You can see not so many rows, almost 22k, but quite a few columns, over 17k. This is after some data munging to drop entirely missing/duplicated columns even. The census data just has very many slightly different aggregate categories.

Next I save these data files to disk. For data that does not change very often, you just want to do this process a single time and save that data somewhere you can more easily access it. No need to re-download the data from the internet/census site everytime you want to do a new analysis.

I don’t have timing data here, but you can just experiment to see the parquet data format is quite a bit faster to save (and csv formats are the slowest). DuckDB is smart and just knows to look at your local namespace to find the referenced pandas dataframe in the execute string.

# Save locally to CSV file
cen2019_small.to_csv('census_test.csv')

# Trying zip compression
cen2019_small.to_csv('census_test.csv.zip',compression="zip")

# Save to parquet files
cen2019_small.to_parquet('census.parquet.gzip',compression='gzip',engine='pyarrow')

# Save to DuckDB, should make the DB if does not exist
con = duckdb.connect(database='census.duckdb',read_only=False)
con.execute('CREATE TABLE census_2019 AS SELECT * FROM cen2019_small')

If we then go and check out the datasizes on disk, csv for just these two states is 0.8 gigs (the full set of data for all 50 states is closer to 20 gigs). Using zip compression reduces this to around 1/4th of the size for the csv file. Using parquet format (which can be considered an alternative fixed file format to CSV although columnar oriented) and gzip compression is pretty much the same as zip compression for this data (not many missing values or repeat categories of numbers), but if you have repeat categorical data with a bit of missing data should be slightly better compression (I am thinking NIBRS here). The entire DuckDB database is actually smaller than the CSV file (I haven’t checked closely, I try to coerce the data to smarter float/int formats before saving, but there are probably even more space to squeeze out of my functions).

# Lets check out the file sizes
files = ['census_test.csv','census_test.csv.zip',
         'census.parquet.gzip','census.duckdb']

for fi in files:
    file_size = os.path.getsize(fi)
    print(f'File size for {fi} is {file_size/1024**3:,.1f} gigs')

# File size for census_test.csv is 0.8 gigs
# File size for census_test.csv.zip is 0.2 gigs
# File size for census.parquet.gzip is 0.2 gigs
# File size for census.duckdb is 0.7 gigs

The benefit of having a database here like DuckDB is for later SQL querying, as well as the ability to save additional tables. If I scoop up the 2018 data (that has slightly different columns), I can save to an additional table. Then later on downstream applications can select out the limited columns/years as needed (unlikely any real analysis workflow needs all 17,000 columns).

# Can add in another table into duckdb
cen2018_small, fields2018 = census_funcs.get_data(year=2018)
con.execute('CREATE TABLE census_2018 AS SELECT * FROM cen2018_small')
con.close()

ducksize = os.path.getsize(files[-1])
print(f'File size for {files[-1]} with two tables is {ducksize/1024**3:,.1f} gigs')
# File size for census.duckdb with two tables is 1.5 gigs

Sqllite is nice, as you can basically share a sqllite file and you know your friend will be able to open it. I have not worked with DuckDB that much, but hopefully it has similar functionality and ability to share without too much headache.

I have not worried about doing timing – I don’t really care about write timings of these data formats compared to CSV (slow read timing is annoying, but 10 seconds vs 1 minute to read data is not a big deal). But it is good practice to not be gluttonous with on disk space, which saving a bunch of inefficient csv files can be a bit wasteful.

Legends in python

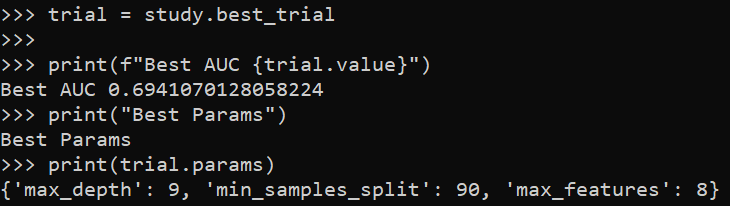
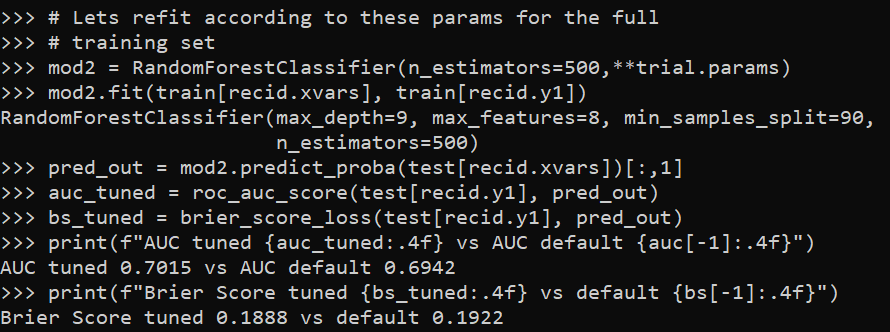
Legends in python and matplotlib can be a little tricky (it is quite a web of different objects). Here are a few notes I have collected over different projects. First, one thing python does not do, even if you name things the same, it does not combine them in a legend. First example will show superimposing lines and error bars – even though I only have two labels, they each get their own slot in the resulting legend.

import numpy as np
import geopandas as gpd

# Need a bunch of junk from matplotlib
import matplotlib
from matplotlib import pyplot as plt
from matplotlib import patches
from matplotlib.legend_handler import HandlerPatch

# Making simple fake data
x = [0,1,2,3]
y1 = np.array([1,1,1,1])
y1l = y1 - 0.5
y1h = y1 + 0.5

y2 = np.array([2,2,2,2])
y2l = y2 - 0.1
y2h = y2 + 0.1

# Default, does not combine legends
fig, ax = plt.subplots()
# First Line
ax.plot(x,y1,zorder=3, color='blue',alpha=0.9,label='y1')
ax.fill_between(x,y1l,y1h,alpha=0.2,zorder=2,color='blue',label='y1')
# Second Line
ax.plot(x,y2,zorder=3, color='k',alpha=0.9,label='y2')
ax.fill_between(x,y2l,y2h,alpha=0.2,zorder=2,color='k',label='y2')
ax.legend(bbox_to_anchor=(1.0, 0.5))
plt.savefig('Leg01.png', dpi=500, loc="center left", bbox_inches='tight')

You can combine the legend items by scooping out the original objects, here via the ax.get_* function to get the labels and the “handles”. You can think of handles as just points/lines/polygons that refer to individual parts of the legend. And so combining the lines and polygons together, we can make the legend how we want it.

fig, ax = plt.subplots()
# First Line
ax.plot(x,y1,zorder=3, color='blue',alpha=0.9,label='y1')
ax.fill_between(x,y1l,y1h,alpha=0.2,zorder=2,color='blue',label='y1')
# Second Line
ax.plot(x,y2,zorder=3, color='k',alpha=0.9,label='y2')
ax.fill_between(x,y2l,y2h,alpha=0.2,zorder=2,color='k',label='y2')
# Can combine legend items
handler, labeler = ax.get_legend_handles_labels()
hd = [(handler[0],handler[1]),
       (handler[2],handler[3])]
lab = ['y1','y2']
ax.legend(hd, lab, loc="center left", bbox_to_anchor=(1, 0.5))
plt.savefig('Leg02.png', dpi=500, bbox_inches='tight')

I made a simple function combo_legend(ax) to combine items that have the same label in such matplotlib figures. So they do not need to per se be collections of similar items, just have the same text label.

# Can pass these to legend
def combo_legend(ax):
    handler, labeler = ax.get_legend_handles_labels()
    hd = []
    labli = list(set(labeler))
    for lab in labli:
        comb = [h for h,l in zip(handler,labeler) if l == lab]
        hd.append(tuple(comb))
    return hd, labli

# Combo line/error/scatter
fig, ax = plt.subplots()
# First Line
ax.plot(x,y1,zorder=3, color='blue',alpha=0.9,label='y1')
ax.fill_between(x,y1l,y1h,alpha=0.2,zorder=2,color='blue',label='y1')
ax.scatter(x,y1,c='blue', edgecolor='white',
           s=30,zorder=4,label='y1')
# Second Line
ax.plot(x,y2,zorder=3, color='k',alpha=0.9,label='y2')
ax.fill_between(x,y2l,y2h,alpha=0.2,zorder=2,color='k',label='y2')
hd, lab = combo_legend(ax)
ax.legend(hd, lab, loc="center left", bbox_to_anchor=(1, 0.5))
plt.savefig('Leg03.png', dpi=500, bbox_inches='tight')

Note that the set() call makes it so the order may not be how you want. You can just rearrange the objects you get back from combo_legend to sort them in the order you want.

Now for the second example in the post, is going to show some examples munging with geopandas objects/plots.

So default geopandas uses a continuous color ramp:

# Get counties for all US
county_url = r'https://www2.census.gov/geo/tiger/TIGER2019/COUNTY/tl_2019_us_county.zip'
us_county = gpd.read_file(county_url)
# Get counties for North Carolina
nc = us_county[us_county['STATEFP'] == '37'].copy()
nc['wat_prop'] = nc['AWATER']/(nc['AWATER'] + nc['ALAND'])

# Plot proportion area water
fig, ax = plt.subplots(figsize=(8,4))
nc.plot(column='wat_prop', edgecolor='grey', linewidth=0.2, ax=ax, legend=True)
plt.savefig('Leg04.png', dpi=1000, bbox_inches='tight')

I have a tough time with continuous color ramps. The geopandas mapping user guide has an example of making a nicer sized continuous legend, but overall I find making classed choropleth maps much easier in general. geopandas objects have a special set of arguments, where you can pass information to class the map and make a legend:

# Make the legend not the raster scale
bin_edge = np.arange(0.2,0.9,0.2)
leg_args = {'loc': 'lower left',
            'prop': {'size': 9},
            'title':'Prop. Water'}

fig, ax = plt.subplots(figsize=(8,4))
nc.plot(column='wat_prop',
        scheme="User_Defined",
        classification_kwds=dict(bins=bin_edge),
        legend_kwds=leg_args,
        edgecolor='grey',
        linewidth=0.2,
        ax=ax,
        legend=True)
plt.savefig('Leg05.png', dpi=1000, bbox_inches='tight')

But now we have circles. ArcGIS has the ability to use different glyphs in its legends, and it is common to use a blocky type glyph for geopolitical boundaries (which have unnatural straight lines).

If you go down the rabbit hole of geopandas objects, in this scenario the matplotlib handler is actually the same Line2D type object as if you call ax.plot(). So hacking together from a matplotlib doc tutorial, we can make a custom handler to draw our prespecified glyph. (Don’t take this as a nice example legend glyph, just threw something together very quick!) I also add in different labels to signify the boundary edges for the choropleth bins.

class MapHandler:
    def legend_artist(self, legend, orig_handle, fontsize, handlebox):
        x0, y0 = handlebox.xdescent, handlebox.ydescent
        # Can handle lines or polygons
        try:
            face_col = orig_handle.get_markerfacecolor()
        except:
            face_col = orig_handle.get_facecolor()
        width, height = handlebox.width, handlebox.height
        # Ugly shape, can make your own!
        xy = [[0,0],
              [1,0.2],
              [0.7,1],
              [0.05,0.4]]
        xy2 = []
        for x,y in xy:
            xt = x*width
            yt = y*height
            xy2.append([xt,yt])
        patch = patches.Polygon(xy2, fc=face_col)
        handlebox.add_artist(patch)
        return patch

leg_args2 = leg_args.copy()
leg_args2['handler_map'] = {matplotlib.lines.Line2D: MapHandler()}
leg_args2['labels'] = ['[0.0 to 0.2)','[0.2 to 0.4)','[0.4 to 0.6)','[0.6 to 0.8]']

fig, ax = plt.subplots(figsize=(8,4))
nc.plot(column='wat_prop',
        scheme="User_Defined",
        classification_kwds=dict(bins=bin_edge),
        legend_kwds=leg_args2,
        edgecolor='grey',
        linewidth=0.2,
        ax=ax,
        legend=True)
plt.savefig('Leg06.png', dpi=1000, bbox_inches='tight')

This will be sufficient for many peoples choropleth map needs, but often times in maps you superimpose additional things, such as roads or other types of boundaries. So it may be necessary to go back into the legend and rebuild it entirely.

Here is an example of adding in something totally different, an ellipse, into the legend:

# Taken from that same matplotlib doc linked earlier
class HandlerEllipse(HandlerPatch):
    def create_artists(self, legend, orig_handle,
                       xdescent, ydescent, width, height, fontsize, trans):
        center = 0.5 * width - 0.5 * xdescent, 0.5 * height - 0.5 * ydescent
        p = patches.Ellipse(xy=center, width=width + xdescent,
                             height=height + ydescent)
        self.update_prop(p, orig_handle, legend)
        p.set_transform(trans)
        return [p]

fig, ax = plt.subplots(figsize=(8,4))
nc.plot(column='wat_prop',
        scheme="User_Defined",
        classification_kwds=dict(bins=bin_edge),
        legend_kwds=leg_args2,
        edgecolor='grey',
        linewidth=0.2,
        ax=ax,
        legend=True)

# ax.get_legend_handles_labels() does not work here
leg = ax.get_legend()
handlers = leg.legendHandles
p = patches.Ellipse(xy=(0,0),width=2,height=1,facecolor='red')
handlers += [p]
new_labs = ['a','b','c','d','Whatever']
new_map = leg.get_legend_handler_map()
new_map[matplotlib.patches.Polygon] = MapHandler()
new_map[matplotlib.patches.Ellipse] = HandlerEllipse()
ax.legend(handlers, new_labs, handler_map=new_map, loc='lower left')
plt.savefig('Leg07.png', dpi=1000, bbox_inches='tight')

Checking for Stale RSS feeds in Python

So while I like RSS feeds, one issue I have noted over the years is that people/companies change the url for the feed. This ends up being a silent error in most feed readers (I swear the google reader had some metrics for this, but that was so long ago).

I have attempted to write code to check for not working feeds at least a few different times and given up. RSS feeds are quite heterogeneous if you look closely. Aliquote had his list though that I started going through to update my own, and figured it would be worth a shot to again filter out old/dormant feeds when checking out new blogs.

So first we will get the blog feeds and Christophe’s tags for each blog:

from bs4 import BeautifulSoup
from urllib.request import Request, urlopen
import pandas as pd
import ssl
import warnings # get warnings for html parser
warnings.filterwarnings("ignore", category=UserWarning, module='bs4')

# aliquotes feed list
feeds = r'https://aliquote.org/pub/urls~'
gcont = ssl.SSLContext()
head = {'User-Agent': 'Chrome/104.0.0.0'}
response = urlopen(Request(feeds,headers=head),context=gcont).read()
list_feeds = response.splitlines()

I do not really know anything about SSL and headers (have had some small nightmares recently on work machines with ZScaler and getting windows subsystem for linux working with poetry/pip). So caveat emptor.

Next we have this ugly function I wrote. It could be cleaned up no doubt, but RSS feeds can fail (either website down, or the url is old/bad), so wrap everything in a try. Also most feeds have items/pubdate tags, but we have a few that have different structure. So all the if/elses are just to capture some of these other formats as best I can.

# Ugly Function to grab RSS last update
def getrss_stats(feed,context=gcont,header=head):
    try:
        req = Request(feed,headers=header)
        response = urlopen(req,context=context)
        soup = BeautifulSoup(response,'html.parser')
        all_items = soup.find_all("item")
        all_pub = soup.find_all("published")
        all_upd = soup.find_all("updated")
        if len(all_items) > 0:
            totn = len(all_items)
            if all_items[0].pubdate:
                last_dt = all_items[0].pubdate.text
            elif all_items[0].find("dc:date"):
                last_dt = all_items[0].find("dc:date").text
            else:
                last_dt = '1/1/1900'
        elif len(all_pub) > 0:
            totn = len(all_pub)
            last_dt = all_pub[0].text
        elif len(all_upd) > 0:
            totn = len(all_upd)
            last_dt = all_upd[0].text
        else:
            totn = 0 # means able to get response
            last_dt = '1/1/1900'
        return [feed,totn,last_dt]
    except:
        return [feed,None,None]

This returns a list of the feed url you put in, as well as the total number of posts in the feed, and the (hopefully) most recent date of a posting. Total numbers is partially a red herring, people may only publish to the feed some limited number of recent blog posts. I fill in missing data from a parsed feed as 0 and ‘1/1/1900’. If the response just overall was bad you get back None values.

So now I can loop over the list of our feeds. Here I only care about those with stats/python/sql (not worrying about Julia yet!):

# Looping over the list
# only care about certain tags
tg = set(['stats','rstats','python','sql'])
fin_stats = []

# Takes a few minutes
for fd in list_feeds:
    fdec = fd.decode().split(" ")
    rss, tags = fdec[0], fdec[1:]
    if (tg & set(tags)):
        rss_stats = getrss_stats(rss)
        rss_stats.append(tags)
        fin_stats.append(rss_stats.copy())

These dates are a bit of a mess. But this is the quickest way to clean them up I know of via some pandas magic:

# Convert data to dataframe
rss_dat = pd.DataFrame(fin_stats,columns=['RSS','TotItems','LastDate','Tags'])

# Coercing everything to a nicer formatted day
rss_dat['LastDate'] = pd.to_datetime(rss_dat['LastDate'].fillna('1/1/1900'),errors='coerce',utc=False)
rss_dat['LastDate'] = pd.to_datetime(rss_dat['LastDate'].astype(str).str[:11])

rss_dat.sort_values(by='LastDate',ascending=False,inplace=True,ignore_index=True)
print(rss_dat.head(10))

And you can see (that links to csv file) that most of Christophe’s feed is up to date. But some are dormant (Peter Norvig’s blog RSS is dormant, but his github he posts snippets/updates), and some have moved to different locations (such as Frank Harrell’s).

So for a feed reader to do something like give a note when a feed has not been updated for say 3 months I think would work for many feeds. Some people have blogs that are not as regular (which is fine), but many sites, such as journal papers, something is probably wrong if no updates for several months.

Gun Buy Back Programs Probably Don’t Work

When I was still a criminology professor, I remember one day while out getting groceries receiving a cold call from a police department interested in collaborating. They asked if I could provide evidence to support their cities plan to implement sex offender residence restrictions. While taking the call I was walking past a stand for the DARE program.

A bit of inside pool for my criminology friends, but for others these are programs that have clearly been shown to not be effective. Sex offender restrictions have no evidence they reduce crimes, and DARE has very good evidence it does not work (and some mild evidence it causes iatrogenic effects – i.e. causes increased drug use among teenagers exposed to the program).

This isn’t a critique of the PD who called me – academics just don’t do a great job of getting the word out. (And maybe we can’t effectively, maybe PDs need to have inhouse people do something like the American Society of Evidence Based Policing course.)

One of the programs that is similar in terms of being popular (but sparse on evidence supporting it) are gun buy back programs. Despite little evidence that they are effective, cities still continue to support these programs. Both Durham and Raleigh recently implemented buy backs for example.


What is a gun buy back program? Police departments encourage people to turn in guns – no questions asked – and they get back money/giftcards for the firearms (often in the range of $50 to $200). The logic behind such programs is that by turning in firearms it prevents them from being used in subsequent crimes (or suicides). No questions asked is to encourage individuals who have even used the guns in a criminal manner to not be deterred from turning in the weapons.

There are not any meta-analyses of these programs, but the closest thing to it, a multi-city study by Ferrazares et al. (2021), analyzing over 300 gun buy backs does not find macro, city level evidence of reduced gun crimes subsequent to buy back programs. While one can cherry pick individual studies that have some evidence of efficacy (Braga & Wintemute, 2013; Phillips et al., 2013), the way these programs are typically run in the US they are probably not effective at reducing gun crime.

Lets go back to first principles – if we 100% knew a gun would be used in the commission of a crime, then “buying” that gun would likely be worth it. (You could say an inelastic criminal will find or maybe even purchase a new gun with the reward, Mullin (2001), so that purchase does not prevent any future crimes, but I am ignoring that here.)

We do not know that for sure any gun will be used in the commission of a crime – but lets try to put some guesstimates on the probability that it will be used in a crime. There are actually more guns in the US than there are people. But lets go with a low end total of 300 million guns (Braga & Wintemute, 2013). There are around half a million crimes committed with a firearm each year (Planty et al., 2013). So that gives us 500,000/300,000,000 ~ 1/600. So I would guess if you randomly confiscated 600 guns in the US, you would prevent 1 firearm crime.

This has things that may underestimate (one gun can be involved in multiple crimes, still the expected number of crimes prevented is the same), and others that overestimate (more guns, fewer violent crimes, and replacement as mentioned earlier). But I think that this estimate is ballpark reasonable – so lets say 500-1000 guns to reduce 1 firearm crime. If we are giving out $200 gift cards per weapon returned, that means we need to drop $100k to $200k to prevent one firearm crime.

Note I am saying one firearm crime (not homicide), if we were talking about preventing one homicide with $200k, that is probably worth it. That is not a real great return on investment though for the more general firearm crimes, which have costs to society typically in the lower 5 digit range.

Gun buy backs have a few things going against them though even in this calculation. First, the guns returned are not a random sample of guns. They tend to be older, long guns, and often not working (Kuhn et al., 2021). It is very likely the probability those specific guns would be used in the commission of a crime is smaller than 1/600. Second is just the pure scope of the programs, they are often just around a few hundred firearms turned in for any particular city. This is just too small a number to reasonably tell whether they are effective (and what makes the Australian case so different).

Gun buy backs are popular, and plausibly may be “worth it”. (If encouraging working hand guns (Braga & Wintemute, 2013) and the dollar rewards are more like $25-$50 the program is more palatable in my mind in terms of at least potentially being worth it from a cost/benefit perspective.) But with the way most of these studies are conducted, they are hopeless to identify any meaningful macro level crime reductions (at the city level, would need to be more like 20 times larger in scope to notice reductions relative to typical background variation). So I think more proven strategies, such as focussed deterrence or focusing on chronic offenders, are likely better investments for cities/police departments to make instead of gun buy backs.

References

My experience with remote work

So various CEO’s suggesting we should go back into the office (Zuckerberg, Musk) have been in the news recently. Was prompted to write this blog post, as a story about Malcolm Gladwell was shared on Hackernews that literally made me lol, Malcolm Gladwell opposes WFH while he works from his couch for the last 20 years.

To be fair to Gladwell, I just read that Fortune article (I did not listen to his podcast). Of course this is hypocritical of Gladwell, but to steel man his argument I think there is a mixture of individuals in how they respond to remote work. Some individuals will be better suited to in person work, whereas others being remote will be just as productive.

Whether everyone should blanket go back to in person work depends on the proportion of people in those categories. If many more people are in the need oversight to get stuff done group, then sure going back to office makes sense. If that is not the case though, still being full remote or allowing flexibility is likely the better option.


For my own experience with remote work, I started at HMS (now Gainwell Technologies) in December 2019. So before the pandemic, but I was intentionally applying to in person jobs. My experience in academia (both as a student and a professor), very few people came into their office. I thought this was bad (professors being deadwoods for the most part). And part of my personal productivity I attributed to consistently putting in regular hours. In grad school I would go into my office and put in my 8 hours throughout the week. As a professor I would come in 8 to 4 on weekdays, and then also put in a half day on either Saturday or Sunday.

At HMS on our team, we had an informal ‘can work from home’ on Fridays. We just get a laptop to plug into our cubicle, and when working remotely we can simply VPN into the network. We all had 30+ minute commutes into the office, so it was nice to forego that at least once a week. So when the pandemic started in 2020, it was not that big of a deal. The majority of our meetings were video meetings anyway, since HMS had business teams all over the place. The only consistent in-person event that differed was not sitting down and having lunch together with the team.

So it was not that much of a culture shift to go to 100% remote at HMS.

Personally I think my productivity is about the same. There are of course more distractions at home – I don’t have someone behind my cubicle to stop me from reading whatever on the internet. Even if I put in 8 hours, I think maybe productive ‘write real code that takes effort’ is more like on average 4 hours. It is just managing other meetings and easy stuff in between to be able to focus those 4 hours. Which was true in the office as well – I could flake off for a week doing random projects just as easy in the office as I could at home.

So now that I have done it, I personally like remote work quite a bit. I think it improved my home life (as I could be more present and involved with wife and son in daily activities). And this for me greatly outweighs any minor cultural benefits of being in the office (such as sharing lunch with my coworkers).

I had a few things going for me that I believe made remote work easier. 1) My son was older at the time, and my wife stays home. Remote school was ridiculous for the middle school kids, I am sure it was hellish for the very young children. And if you have a baby at home I imagine that would also be a more severe distraction than an older child.

Probably just as importantly 2) I was myself older, more mature and independent. I could see how being 22 and not being at the stage where you can read the room and go do work on your own could limit your productivity in a remote setting.


Like I said earlier, I think there is a mixture of individuals who will (or will not) do well in a remote setting. While many people write about missing out on personal experiences, I think this totally misses the mark (at least for data scientists and maybe software engineers). From a business perspective, you just care if your engineers are productive. While cultural benefits may on the margin keep someone (or push someone out) of an organization, I don’t think they will impact the day to day productivity of an individual. Me having lunch with my coworkers did not make me more or less productive.

What in my opinion matters the most is a coders ability to independently stay focused on tasks. If you can do that, you can work remote just fine. If you cannot, remote work will be a challenge.

This ability of course matters in an office setting as well. It is just you can more comfortably shirk your responsibilities in a remote setting than you can sitting in an office cubicle.

For organizations, they need to weigh the good and the bad with remote work in the end. For the good, you can recruit people anywhere (my team at Gainwell is currently spread across all continental US time zones, if you are a data scientist in Alaska or Hawaii hit me up!). I suspect that benefit far outweighs any cultural reason to go back into the workplace.

Even if the average productivity for your workforce decreases with remote work (which I grant is plausible, although I think would be at worst a tiny decrease), the ability to recruit more widely and retain individuals is a big win for organizations with fully remote options.