So Charles Fain Lehman has a recent post on how decriminalization of opioids in Oregon and Washington (in the name of harm reduction) appear to have resulted in increased overdose deaths. Two recent papers, both using synthetic controls, have come to different conclusions, with Joshi et al. (2023) having null results, and Spencer (2023) having significant results.
I have been doing synth analyses for several groups recently, have published some on micro-synth in the past (Piza et al., 2020). The more I do, the more I am concerned about the default methods. Three main points to discuss here:
- I think the default synth fitting mechanism is not so great, so I have suggested using Lasso regression (if you want a “real” peer-reviewed citation, check out DeBiasi & Circo (2021) for an application of this technique). Also see this post on crime counts/rates and synth problems, which using an intercept in a Lasso regression avoids.
- The fitting mechanism + placebo approach to generate inference can be very noisy, resulting in low powered state level designs. Hence I suggest a conformal inference approach to generate the null distribution
- You should be looking at cumulative effects, not just instant effects in these designs.
I have posted code on Github, and you can see the notebook with the results. I will walk through here quickly. I initially mentioned this technique is a blog post a few years ago (with R code). Here I spent some time to script it up in python.
So first, we load in the data, and go on to conduct the Oregon analysis (you drop Washington as a potential control). Now, a difference in the Abadie estimator (just a stochastic gradient descent optimizer with hard constraints), vs a lasso estimator (soft constraints), is that you need to specify how much to penalize the coefficients. There is no good default for how much, it depends on the scale of your data (doing death rates per 1,000,000 vs per 100,000 will change the amount of penalization), how many rows of data you have, and have many predictor variables you have. So I use an approach to suggest the alpha coefficient for the penalization in a seperate step:
import LassoSynth
import pandas as pd

opioid = pd.read_csv('OpioidDeathRates.csv')
wide = LassoSynth.prep_longdata(opioid,'Period','Rate','State')

# Oregon Analysis
or_data = wide.drop('Washington', axis=1)
oregon = LassoSynth.Synth(or_data,'Oregon',38)

oregon.suggest_alpha() # default alpha is 1
This ends up suggesting an alpha value of 0.17 (instead of default 1). Now you can fit (I passed in the data already to prep it for synth on the init, so no need to re-submit the data):
oregon.fit()
oregon.weights_table()
The fit prints out some metrics, root mean square error and R-squared, {'RMSE': 0.11589514406988406, 'RSquare': 0.7555976595776881}, here for this data. Which offhand looks pretty similar to the other papers (including Charles). And for the weights table, Oregon ends up being very sparse, just DC and West Virginia for controls (plus the intercept):
Group                       Coef
Intercept               0.156239
West Virginia           0.122256
District of Columbia    0.027378
The Lasso model here does constrain the coefficients to be positive, but does not force them to sum to 1 (plus it has an intercept). I think these are all good things (based on personal experience fitting functions). We can graph the fit for the historical data, plus the standard error of the lasso counterfactual forecasts in the post period:
# Default alpha level is 95% prediction intervals for counterfactual
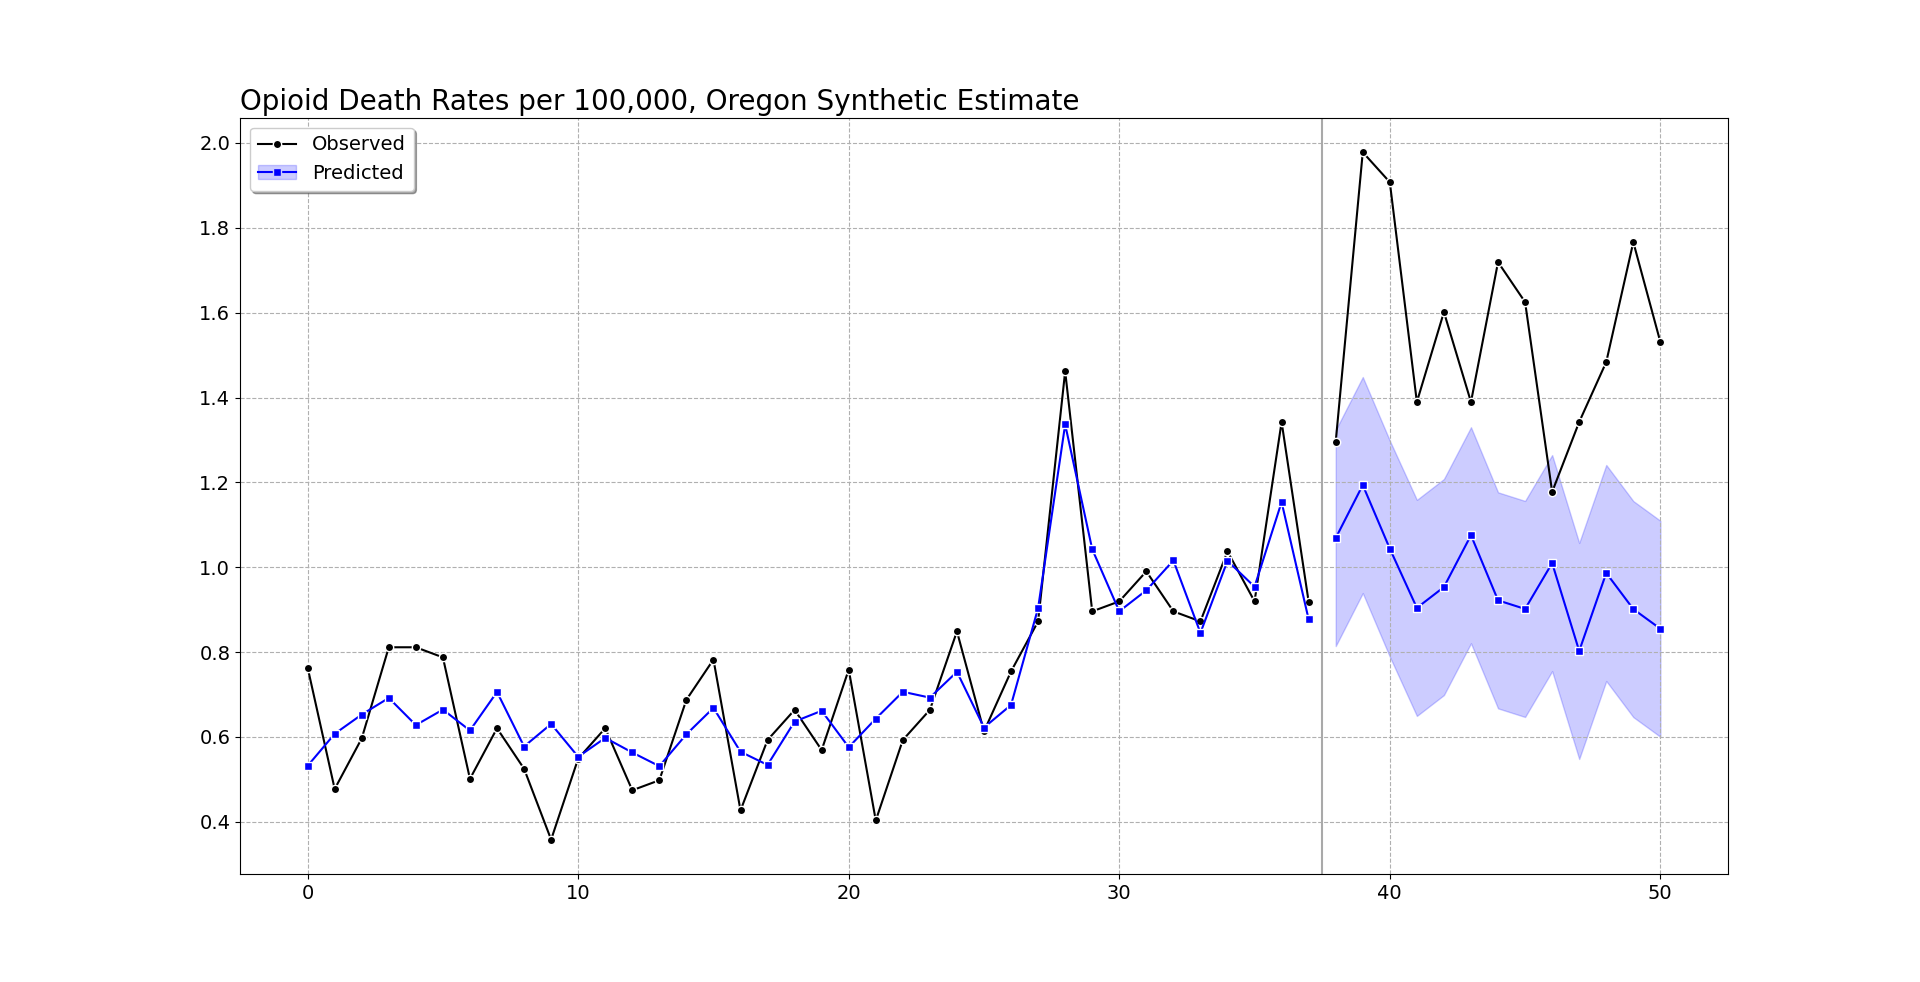
oregon.graph('Opioid Death Rates per 100,000, Oregon Synthetic Estimate')
So you can see the pre-intervention fit is smoother than the monthly data in Oregon, but by eye seems quite reasonable (matches the recent increase and spikes post period 20, starts in Jan-2018, so starting in August-2019). (Perfect fits are good evidence of over-fitting in machine learning.)
Post intervention, after period 37, I do my graph a bit differently. Sometimes people are confused when the intervention starts in the graph, so here I literally split pre/post data lines, so there should be no confusion. I use the conformal inference approach to generate 95% prediction intervals around the counterfactual trend. You can see the counterfactual trend has slightly decreased, whereas Oregon increased and is volatile. Some of the periods are covered by the upper most intervals, but the majority are clearly outside.
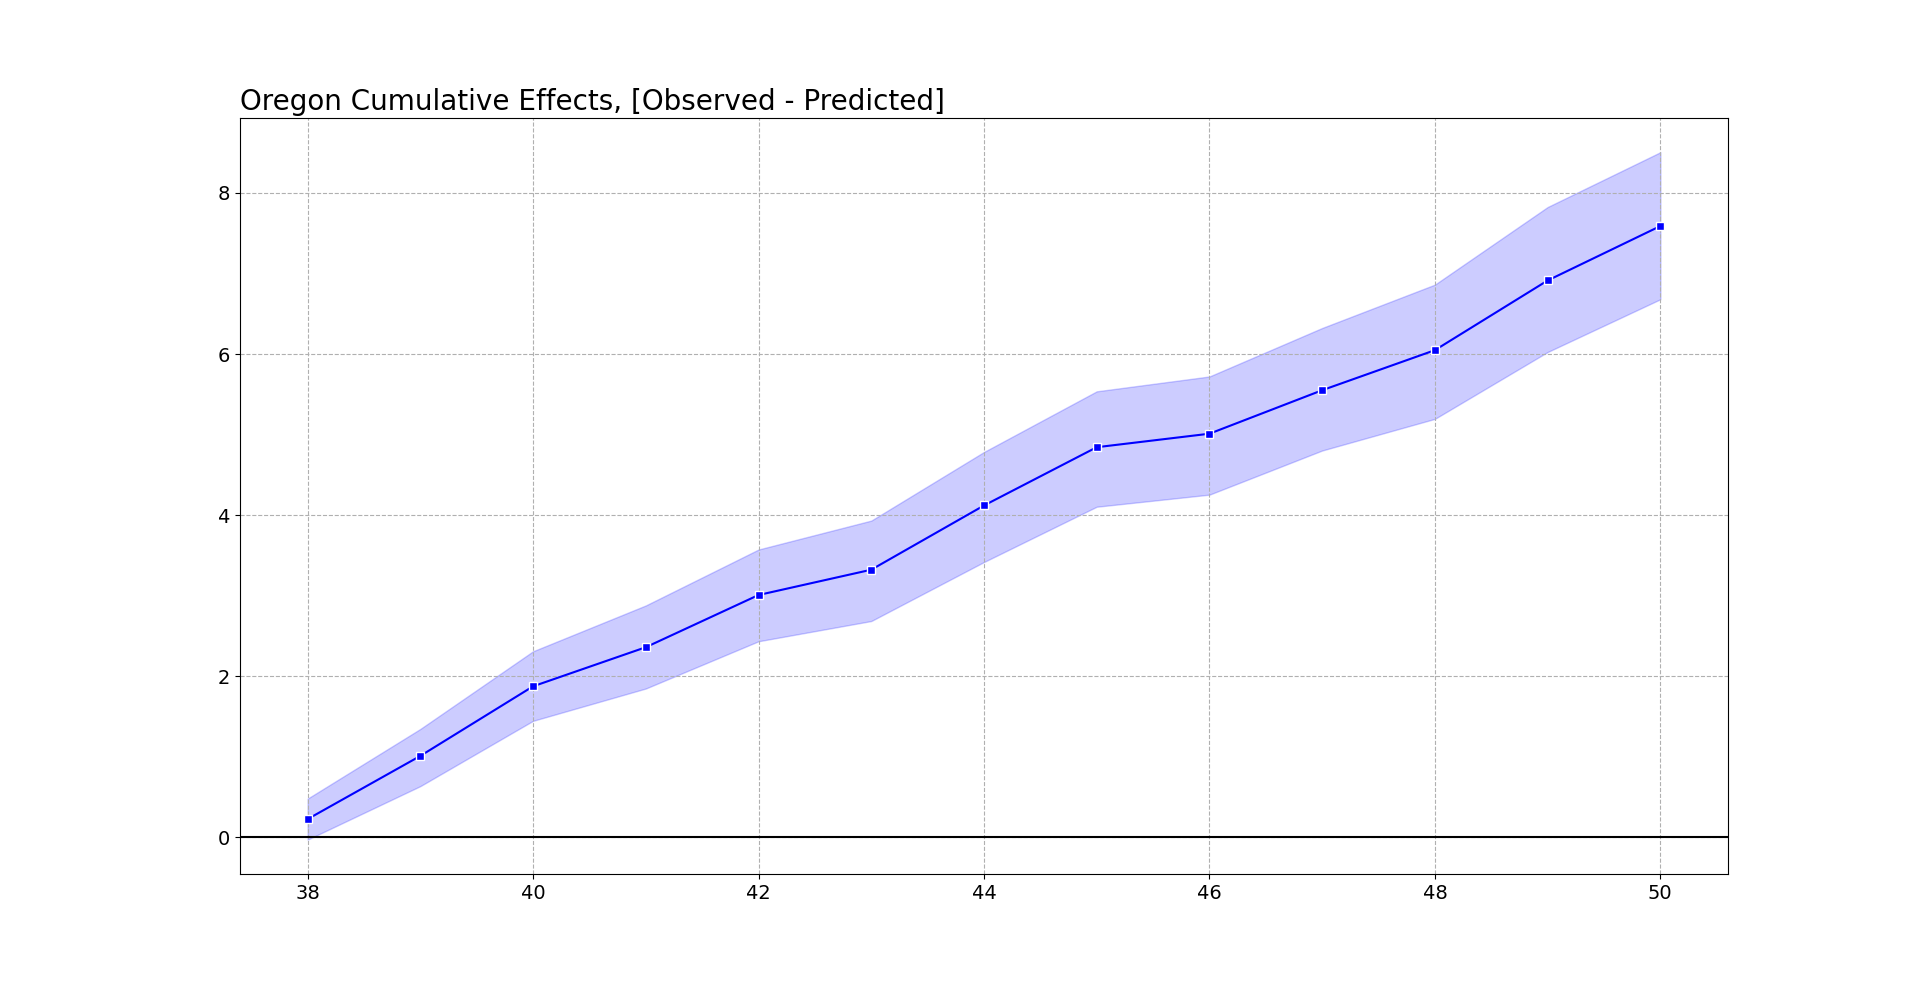
Now, besides the fitting function, one point I want to make is people should be looking at cumulative effects, not just instant effects. So Abadie has a global test, using placebos, that looks at the ratio of the pre-fit to post fit (squared errors), then does the placebo p-value based on that stat. This doesn’t have any consideration though for consistent above/below effects.
So pretend the Oregon observed was always within the 95% counterfactual error bar, but was always consistently at the top, around 0.1 increase in overdose deaths. Any single point-wise monthly inference fails to reject the null, but that overall always high pattern is not regular. You want to look at the entire curve, not just a single point. Random data won’t always be high or low, it should fluctuate around the counterfactual estimate.
To do this you look at the cumulative differences between the counterfactual and the observed (and take into account the error distribution for the counterfactuals).
# again default is 95% prediction intervals
oregon.cumgraph('Oregon Cumulative Effects, [Observed - Predicted]')
Accumulated over time, this is a total of over 7 per 100,000. With Oregon having a population of around 4.1 million, I estimate that the cumulative increased number of overdose deaths is around 290 in Oregon. This is pretty consistent with the results in Spencer (2023) as well (182 increased deaths over fewer months).
To do a global test with this approach, you just look at the very final time period and whether it covers 0. This is what I suggest in-place of the Abadie permutation test, as this has a point estimate and standard error, not just a discrete p-value.
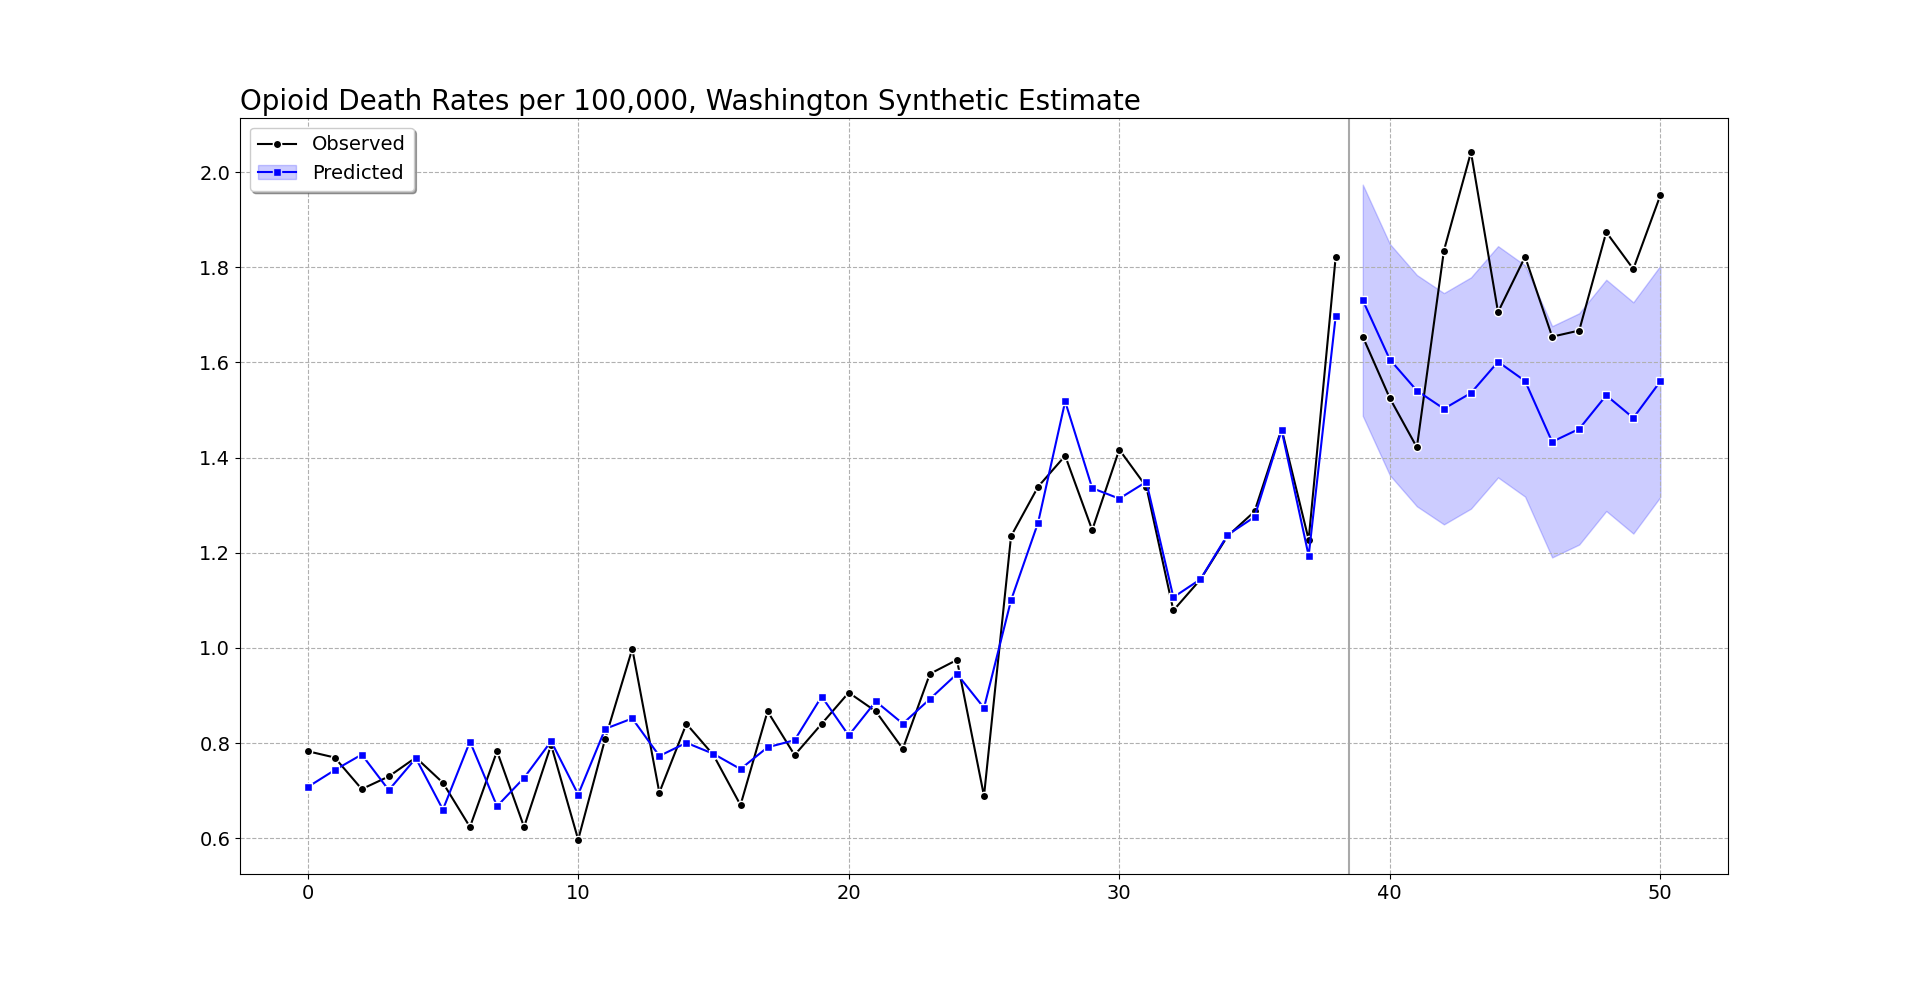
We can do the same analysis for Washington as we did for Oregon. It shows increases, but many of the time periods are covered by the counter-factual 95% prediction interval.

But like I mentioned before, they are consistently high. So when you do the cumulative effects for Washington, they more clearly show increases over time (this data last date is March 2022).

At an accumulated 2.5 per 100,000, with a state population of around 7.7 million, it is around 190 additional overdose deaths in Washington. You can check out the notebook for more stats, Washington has a smaller suggested alpha, so the matched weights have several more states. But the pre-fit is better, and so it has smaller counterfactual intervals. All again good things compared to the default (placebo approach Washington/Oregon will pretty much have the same error distribution, so Washington being less volatile does not matter using that technique).
I get that Abadie is an MIT professor, published a bunch in JASA and well known econ journals, and that his approach is standard in how people do synthetic control analyses. My experience though over time has made me think the default approaches here are not very good – and the placebo approach where you fit many alternative analyses just compounds the issue. (If the fit is bad, it makes the placebo results more variable, causing outlier placebos. People don’t go and do a deep dive of the 49 placebos though to make sure they are well behaved.)
The lasso + conformal approach is how I would approach the problem from my experience fitting machine learning models. I can’t give perfect proof this is a better technique than the SGD + placebo approach by Adadie, but I can release code to at least make it easier for folks to use this technique.
References
-
De Biasi, A., & Circo, G. (2021). Capturing crime at the micro-place: a spatial approach to inform buffer size. Journal of Quantitative Criminology, 37, 393-418.
-
Joshi, S., Rivera, B. D., Cerdá, M., Guy, G. P., Strahan, A., Wheelock, H., & Davis, C. S. (2023). One-year association of drug possession law change with fatal drug overdose in Oregon and Washington. JAMA Psychiatry Online First.
-
Piza, E. L., Wheeler, A. P., Connealy, N. T., & Feng, S. Q. (2020). Crime control effects of a police substation within a business improvement district: A quasi‐experimental synthetic control evaluation. Criminology & Public Policy, 19(2), 653-684.
-
Spencer, N. (2023). Does drug decriminalization increase unintentional drug overdose deaths?: Early evidence from Oregon Measure 110. Journal of Health Economics, 91, 102798.

